Process Mapping and Improvement in Supply Chain, Distribution and Manufacturing
Nowhere are margins as thin as they are in supply chain, distribution, and manufacturing. This means that any continuous-improvement/operation-streamlining effort is a strategic imperative for distributors and manufacturers alike. That’s why they should always start with process mapping. It’s the prerequisite for any continuous-improvement, automation, or analytics effort.
Maximizing the value of your existing systems
Process Mapping and Improvement in Supply Chain, Distribution and Manufacturing
All distributors and manufacturers must increase margins and reduce profit “leakage.” They need to standardize quoting and order intake; they must automate tasks such as margin monitoring and customer shipment notifications. These needs are exacerbated by a host of external forces:
- Heightened M&A activity driven by higher interest rates
- Macro-economic fluctuations
- Disruptions in core and ancillary technologies (which don’t talk to each other)
- Ever-changing regulatory, risk, and compliance constraints
Nowhere are margins as thin as they are in supply chain, distribution, and manufacturing. This means that any continuous-improvement/operation-streamlining effort is a strategic imperative for distributors and manufacturers alike. That’s why they should always start with process mapping. It’s the prerequisite for any continuous-improvement, automation, or analytics effort.
Max out the value of your supply chain and manufacturing tech stack
How to find the best process mapping partner for manufacturing and distribution
The Lab Consulting specializes in process mapping and improvement for numerous industries, not just supply chain, distribution, and manufacturing. Our process-before-technology approach focuses on maximizing the value of your existing technology & systems. We know that, from your ERP to warehouse management system (WMS) and others, you’ve already invested heavily in technology… but likely have fallen short of its full potential and ROI. In other words: no need for new tech or a rip-and-replace.
As a C-suite executive in distribution or manufacturing, you understand the value of operational efficiency more than most people. You’re always searching for ways to enhance your operations, preserve and grow margin, and drive success. In this article, we’ll discuss the services, benefits, and real-life examples of process improvement. We’ll shine a spotlight on how The Lab can help your distribution or manufacturing business to improve operations and inventory management, increase cross-selling and up-selling, and improve margins—in the near-term.
A detailed “explainer” article for executives
Where Do You Find the Best Process-mapping Services for Manufacturing and Distribution?
End-to-end, wall-to-wall, cross-functional process mapping isn’t just a way of documenting your business’ current-state operating procedures. It’s also the transformational Square One for wholesale distributors and manufacturers.
Process-mapping services, whether performed via an in-house team or outside consulting partner, enable manufacturing and distribution businesses to analyze, scrutinize, visualize, and pinpoint opportunities for improvement, as well as automation and measurement of KPIs in existing workflows. Process mapping accomplishes all this, while simultaneously driving the organization toward a more valuable future state where its operational performance is maximized.
By shining a spotlight on inefficiencies and improvement opportunities, distributors and manufacturers can reduce costs, enhance customer service, maximize the value of their technology investments, and lift enterprise value.
In this long-form explainer about process mapping and improvement in supply chain, distribution, and manufacturing, we’ll detail how to map business processes. We’ll show you which tools are used. We’ll point out pitfalls to avoid. And we’ll also show you how to generate an opportunity-rich process-improvement roadmap that will, for example, reduce pricing overrides and SKU-pricing variance, while boosting overall margins, and other strategic-level KPIs, by entire quartiles, in less than a year. How do we know? At The Lab, we have been providing solutions with a proven track record of success and measurable results for distributors and manufacturers for more than 30 years.
DISTRIBUTION AND MANUFACTURING INDUSTRY: PROCESS IMPROVEMENT CATALOGS FROM THE LAB'S LIBRARY
The Lab's Distribution and Manufacturing Operations Knowledge Base


What are process mapping and improvement for manufacturing & distribution?
Process Mapping for Distribution & Manufacturing: The Definition
Process mapping can be defined as the analysis of business workflows to visually depict the steps involved in a specific process from beginning to end. These maps, diagrams, or flowcharts are used to create a visual representation of how a given process operates—and, by extension, how it can be improved. By breaking down the most complicated processes into manageable steps, process mapping gives organizations newfound visibility into their operations.
“Wall-to-wall” process mapping consists of two parts:
- There’s the actual drawing of the process maps themselves. That’s fun.
- There’s also the strategic organizational preparation. That’s harder, and takes longer.
Broken down into three constituent phases, these often take months or years for organizations to complete.
three constituent stages
“Wall-to-wall” process mapping
Inside vs. outside talent for process mapping and improvement
Should Internal or External Teams Be Tasked with Process Mapping in Distribution and Manufacturing?
The largest North American manufacturers and distributors often rely on consulting firms when it comes to mapping activities as part of a process-improvement initiative, during an organizational merger, or when implementing new systems.
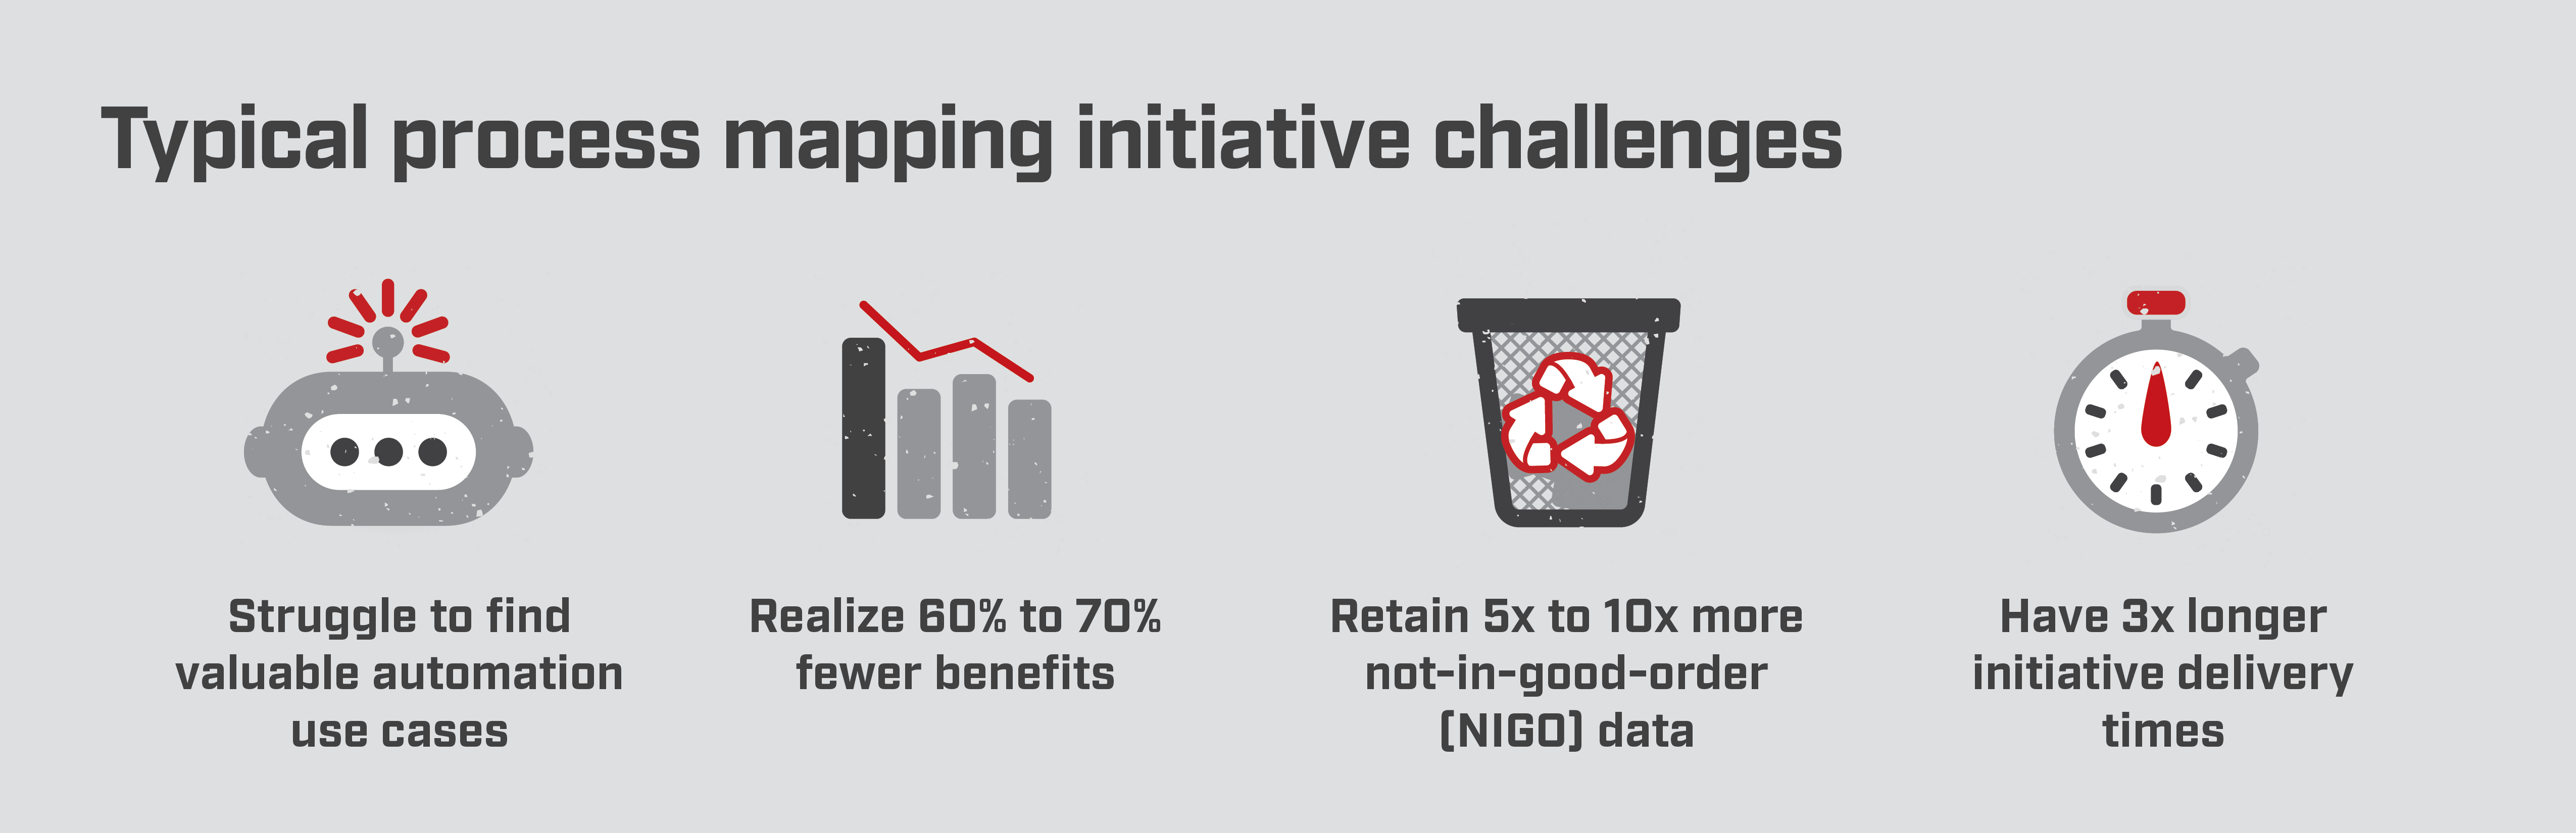
They rarely have a fully mature internal team that can conduct organization-wide end-to-end mapping. By the same token, 70% of mid-sized supply chain, wholesale distribution, and manufacturing firms today lack mature business-process-mapping capabilities. They simply don’t have the resources to perform enterprise-wide process mapping in distribution and manufacturing.
Lean Six Sigma and internal improvement teams
Manufacturers and distributors that possess a mature internal-improvement capability typically task the process-mapping to those teams; process-mapping teams rarely reside within IT. The most common job position for process mapping is “Business Analyst” or perhaps “Process Engineer.” As your data-driven process-improvement needs grow, the best choice for distributors and manufacturers is to seek data scientists with process experience; then you can back them into the traditional business-analyst role.
Where can you find manufacturing and distribution process-mapping consultants?
Specialized process-mapping consulting services, like those from The Lab, speed up and improve manufacturers’ and distributors’ process-mapping capabilities. How? We run the projects, develop the maps, and provide teaching methods that have been employed at scores of other organizations across hundreds of client engagements. At The Lab Consulting, we have turned our 30 years of process-mapping experience into standardized tools and templates which help to accelerate process mapping for our distribution and manufacturing clients.
REAL-LIFE DISTRIBUTION AND MANUFACTURING PROCESS IMPROVEMENT PROJECTS FROM THE LAB
Distribution and Manufacturing Efficiency Case Studies: Process Mapping, Standardization, Automation, Analytics
Flowchart application options
What are the Top Tools and Software Platforms for Process Mapping in Distribution and Manufacturing?
Common tools include:
- White-boards for mapping processes in distribution and manufacturing
– These provide the most basic rapid summaries
– They’re often used in group meetings to draw summary flow - White/brown paper rolls for mapping processes in distribution and manufacturing
– These are big, wall-mounted hand-drawn diagrams, peppered with Post-it notes
– They’re commonly employed by “traditionalist” consultants - Microsoft Visio for mapping processes in distribution and manufacturing
– This is the world’s most ubiquitous process-mapping software for the past ten years
– It’s easy to find and install, due to MS Office 365 - IBM Blueworks for mapping processes in distribution and manufacturing
– This is a proprietary process-mapping software available solely from IBM
– It’s not as popular as it used to be in the past few years - Signavio for mapping processes in distribution and manufacturing
– This is a cloud-based platform
– It’s a reasonable alternative to Visio
Which consultancy offers the most experience in process mapping?
Process Mapping and Improvement Strategy for Supply Chain, Distribution, and Manufacturing from The Lab
The Lab offers a unique approach for process improvement which eliminates all of the limitations of traditional methods. It provides:
- More improvements for manufacturing and distribution. You’ll see end-to-end processes all the way down to the activity level. This will let you identify avoidable rework, automation and AI opportunities, control points, and more.
- Greater benefits for manufacturing and distribution. You’ll gain the ability to measure capacity requirements for each business process or department. This, in turn, will pave the way toward a detailed benefits case to guide and support improvement implementation.
- Rapid analysis for manufacturing and distribution. The Lab’s process analysis is efficient. It requires only 1 hour/week of your staff’s time over a 6-8 week period. This lets you focus on core duties while we do the work of refining and validating our analysis.
- Enhanced outcomes. By benchmarking your operations against manufacturing and distribution best practices, we can identify competitive gaps and design an improved future state for your business.
Have a look at The Lab’s process-map catalog for distributors and manufacturers.
Best practice benchmarking in distribution and manufacturing
Determining the Scope of a Process-mapping Project for Distributors or Manufacturers
You may be surprised to learn just how similar different businesses—whether they’re wholesalers, manufacturers, supply-chain partners, or distributors—are. You may be even more surprised to learn that size doesn’t affect similarity.
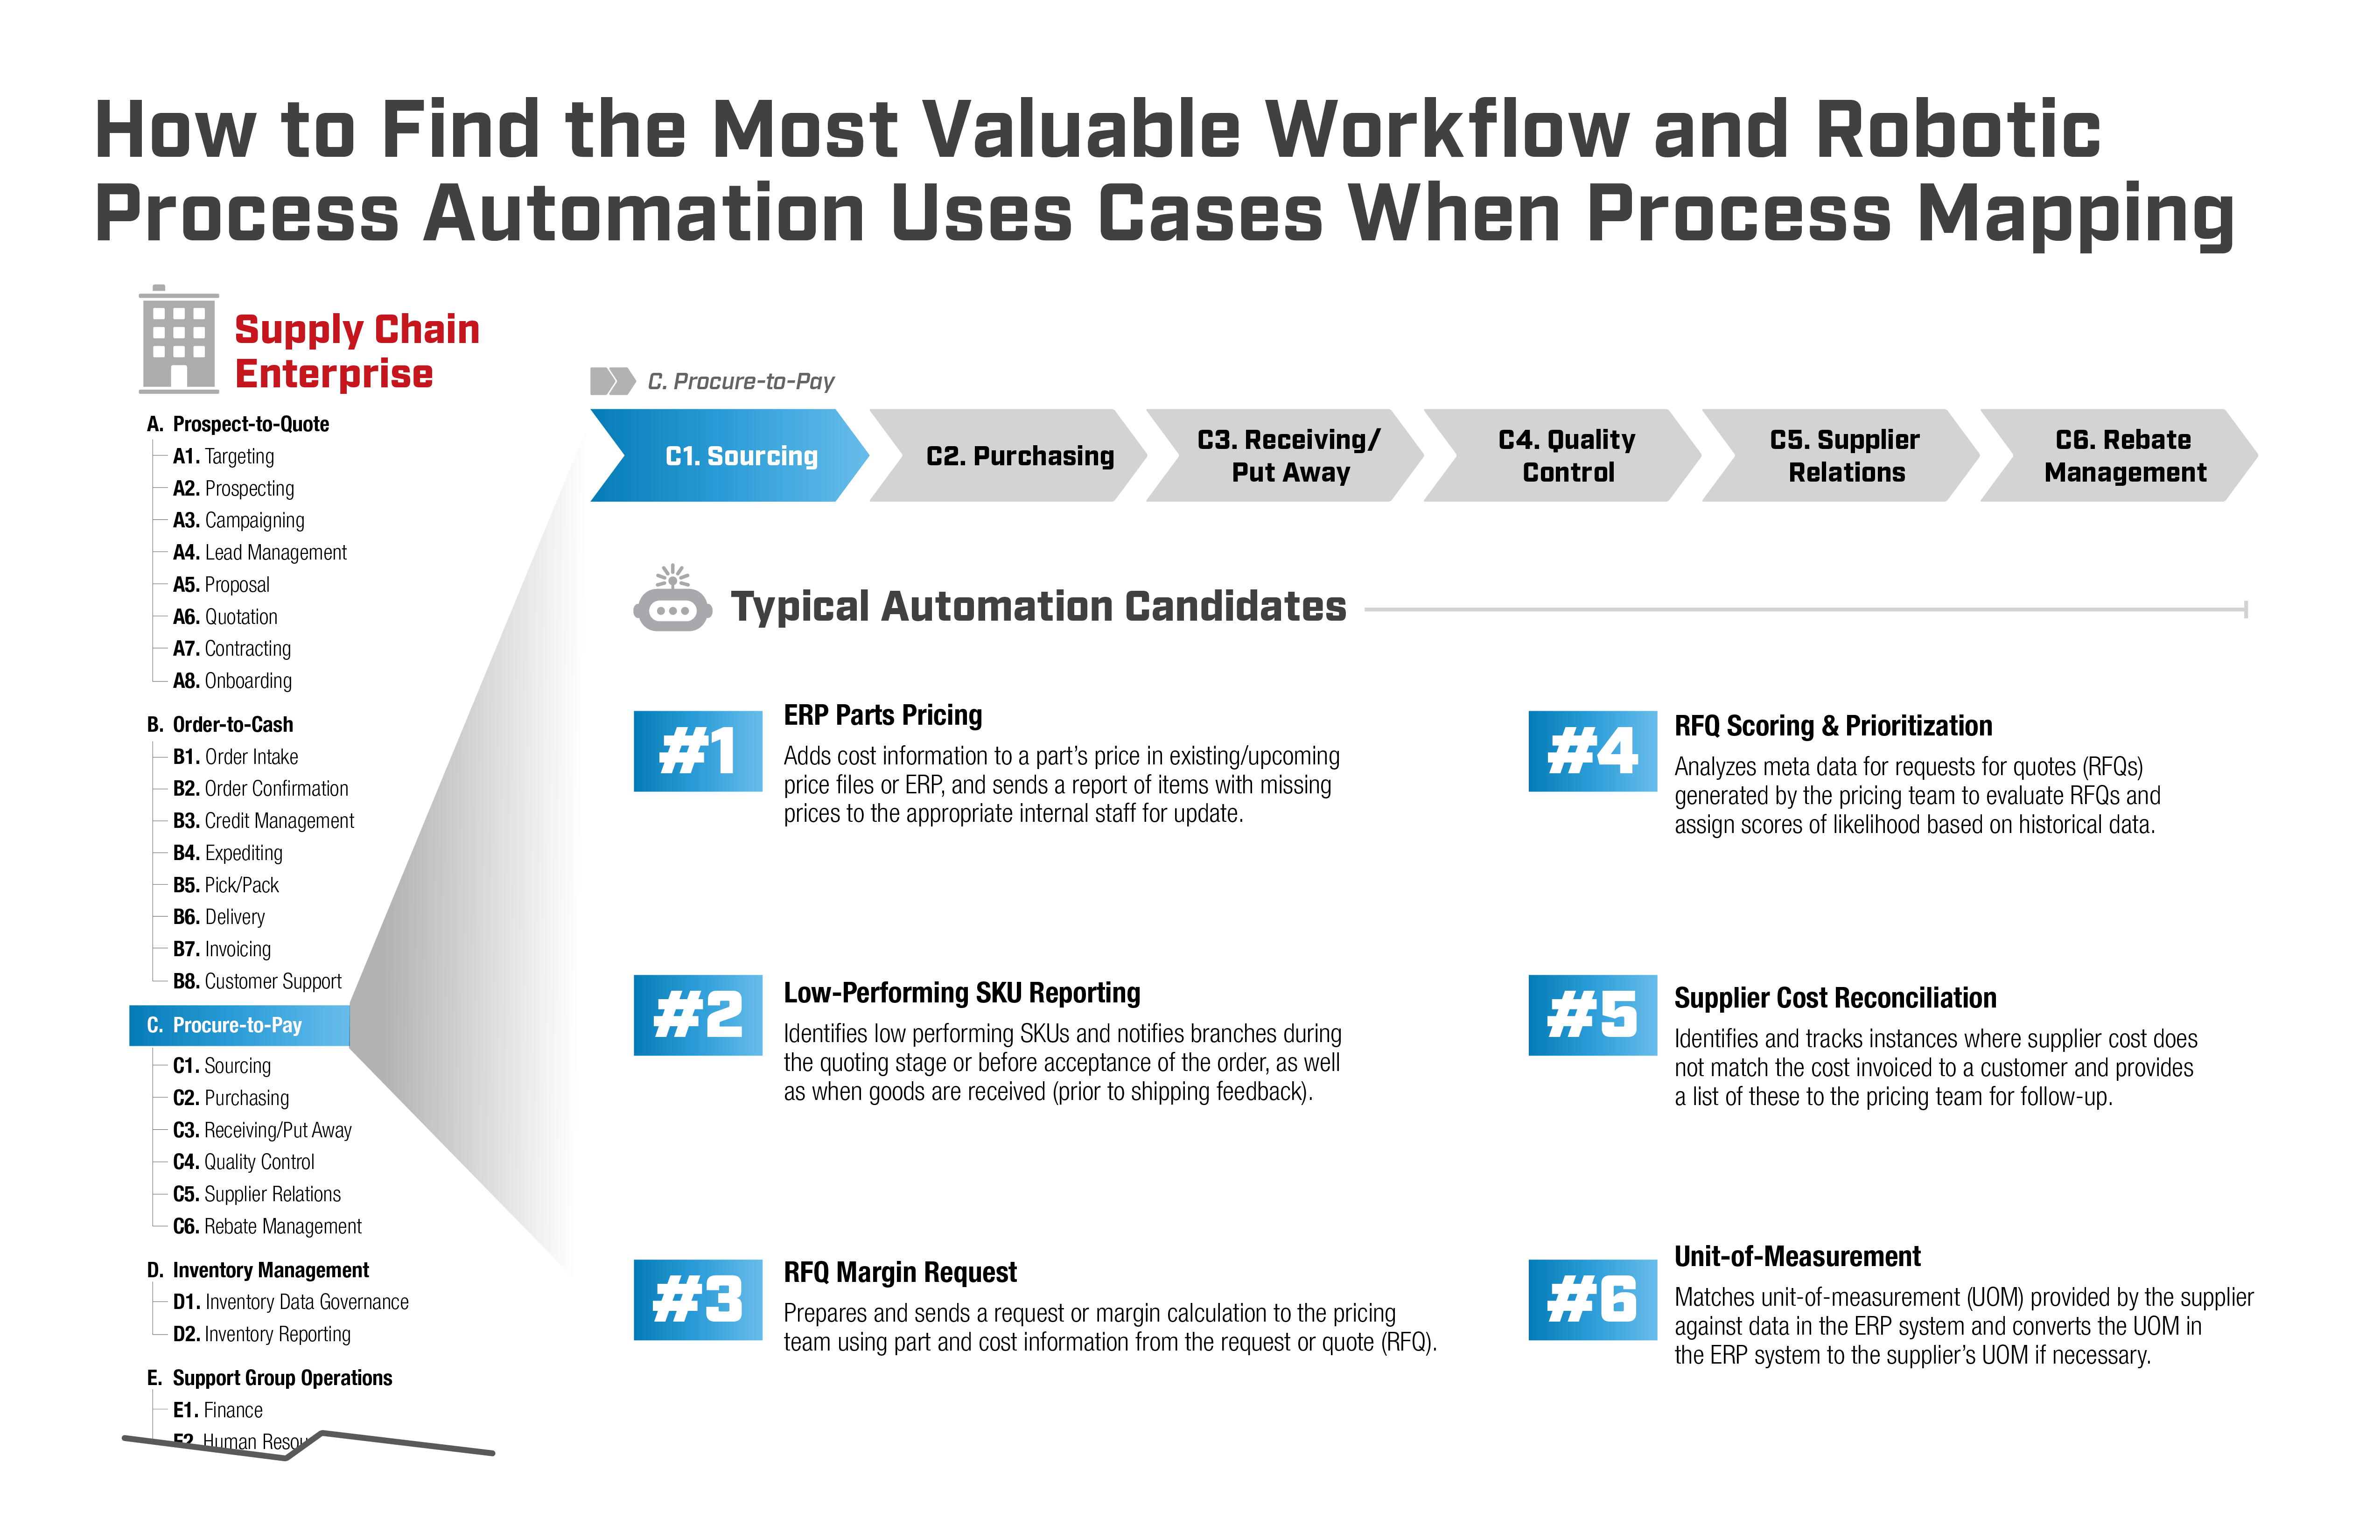
This renders the engagement-scoping relatively straightforward. For example, the prospect-to-quote process at Distributor A will be more than 75 percent similar to that at Distributor B. The same is true for other processes to be mapped, such as order-to-cash, procure-to-pay, inventory management, and more.
In fact, the key differences can be traced to the way the workflows have been configured, by the original implementation teams, in the core systems that are used.
When you scope your process mapping, be sure to follow these best practices:
- Lock in on benefits and ROI: be sure to map across all business functions and departments
- Focus on end-to-end business processes, for example:
– Order-to-cash all the way from order intake (confirmation, credit management, order placement) through fulfillment (pick/pack, ship/track, delivery) and expediting, invoicing, and collections.
– Inventory management from production operations through warehouse operations, dead stock reporting, fleet management, and more. - Be sure to break free of any organizational silos
– Your process mapping should capture the complete customer journey, the entire sales process, all back-office operational steps, and every regulatory check-point and stage-gate - Secure C-level executive sponsorship; without it, discrete organizations may choose to “opt out” of this vital activity
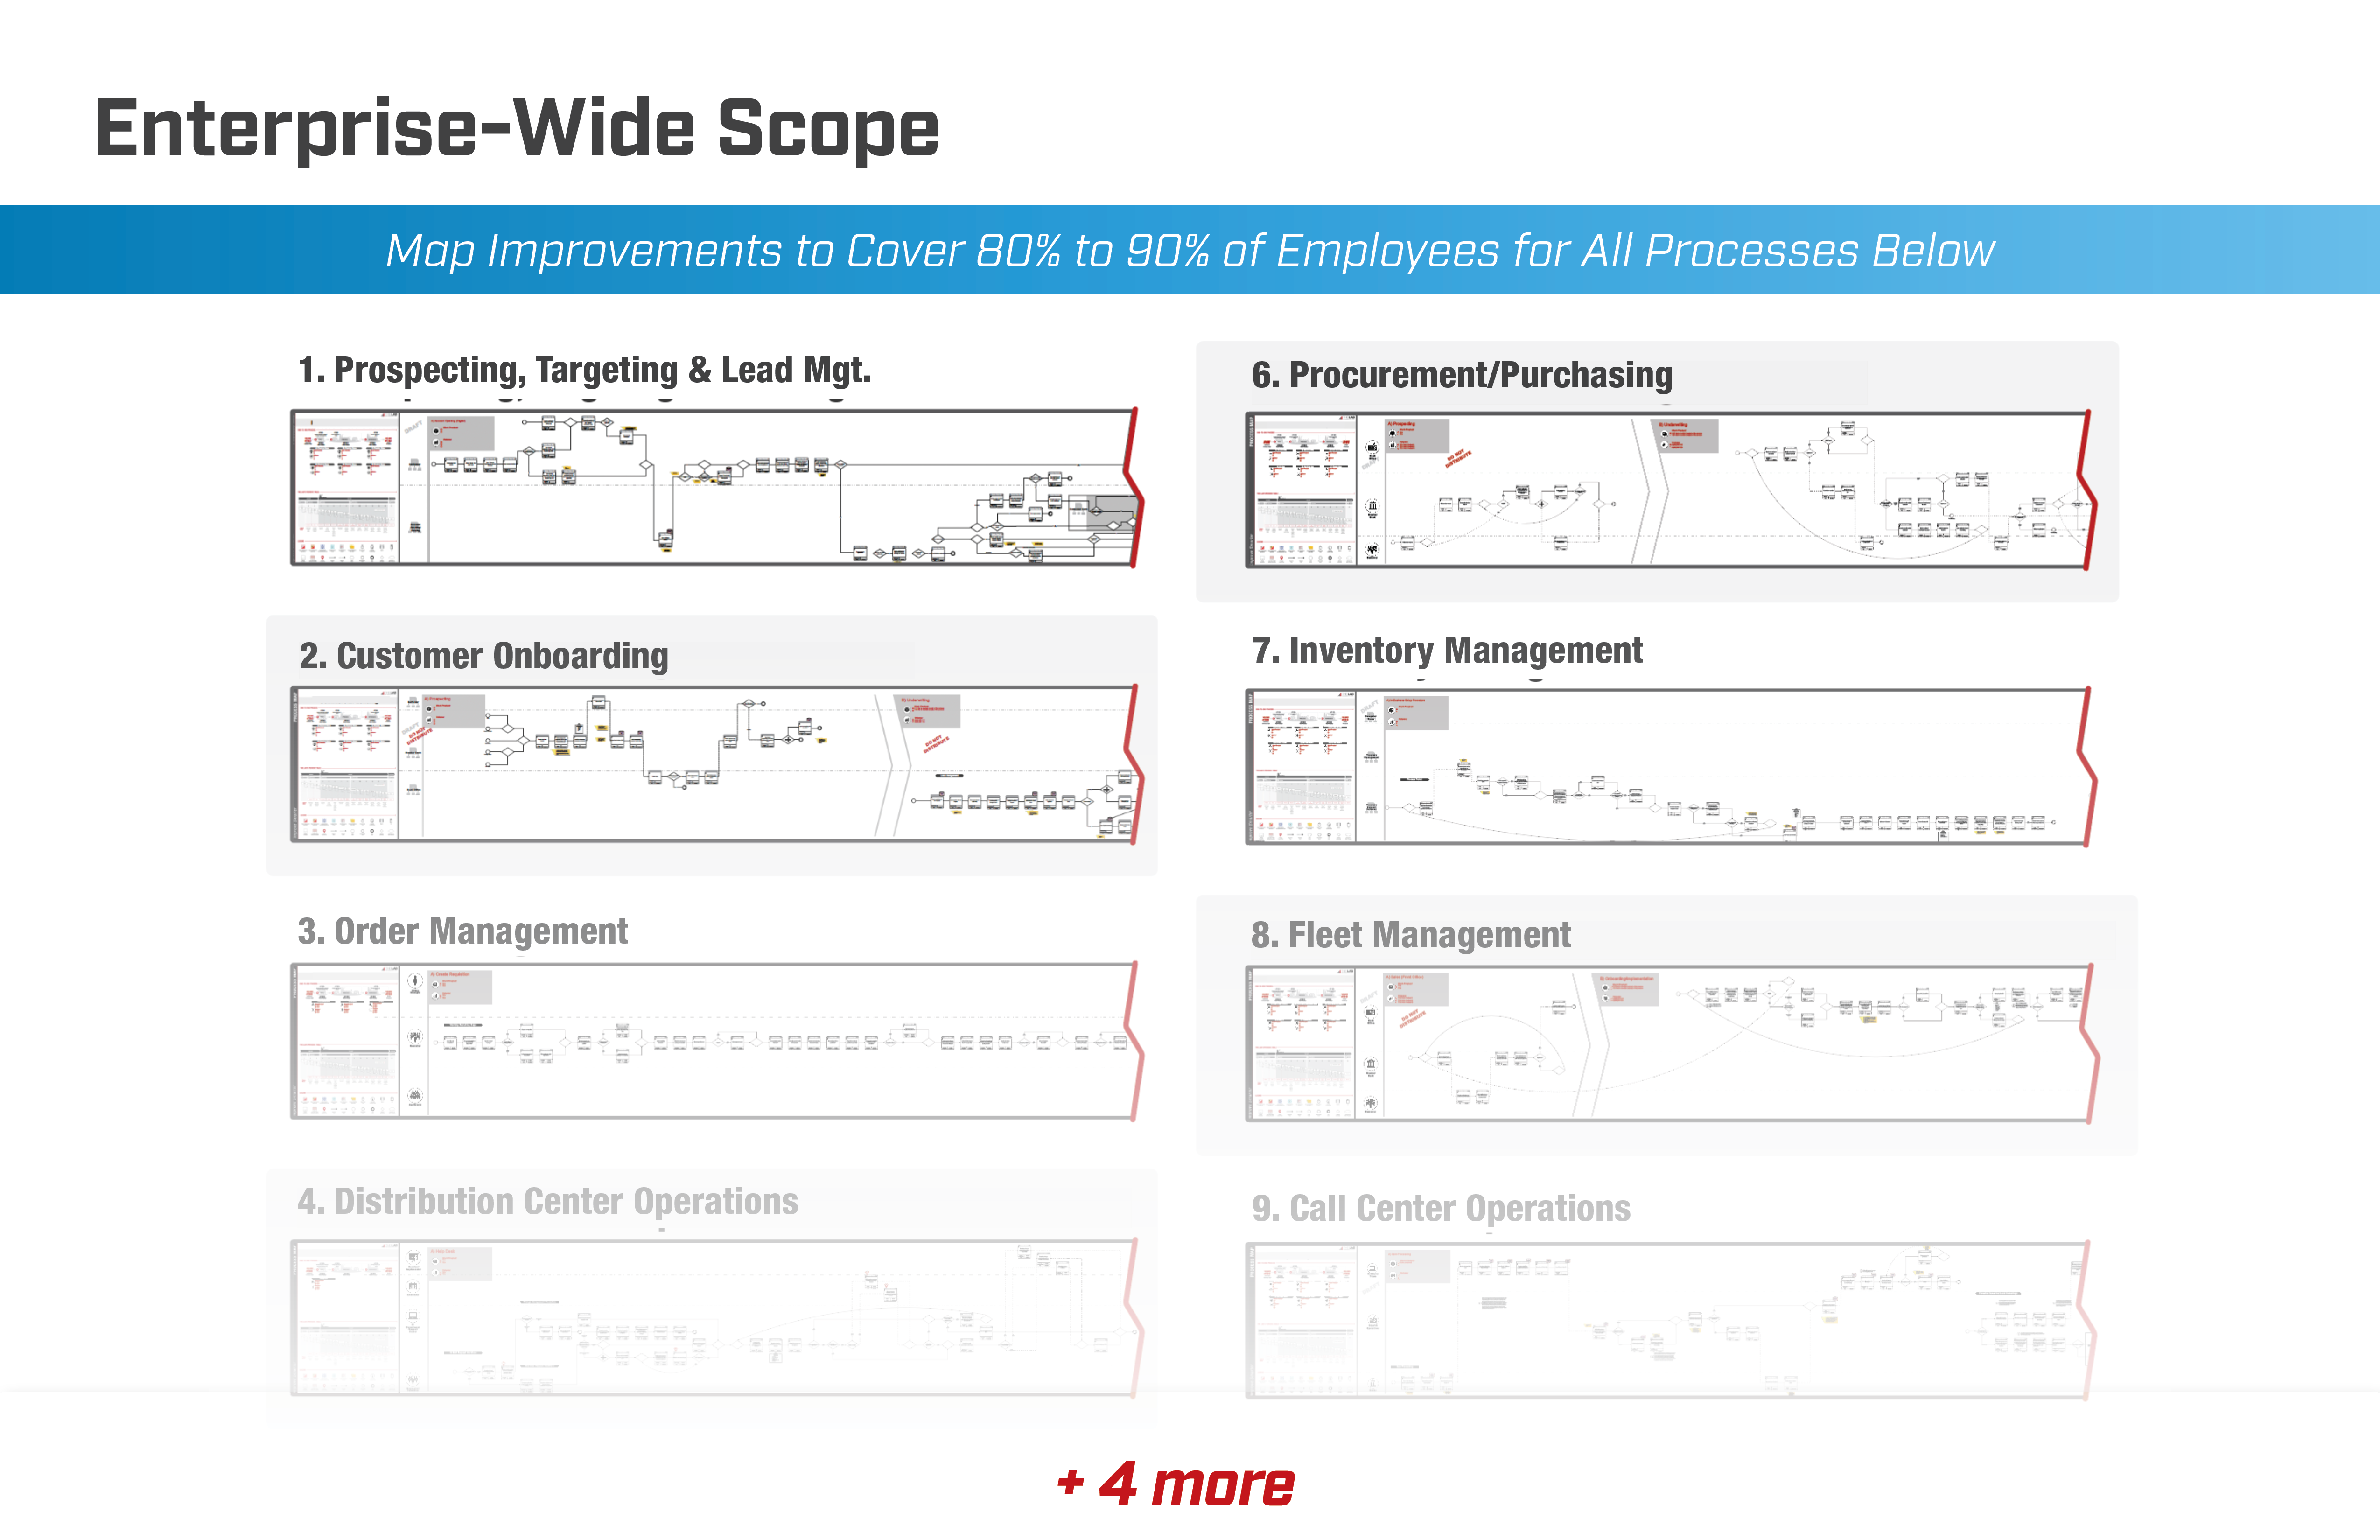
- While process-mapping project scopes will vary slightly by organization, a common example end-to-end scope can be seen below
Why you need to map your distribution or manufacturing processes across all systems you use
Map every department. Map every system. Scour them all: The ERP. The CRM. The WMS. And don’t forget the ancillary systems, such as HRIS, payment-processing systems, data warehouse, and more. Looking at all systems will deliver the end-to-end perspective you need. Put another way: If you define workflows solely within a single system, you’ll dramatically reduce the “lift” of a wall-to-wall approach.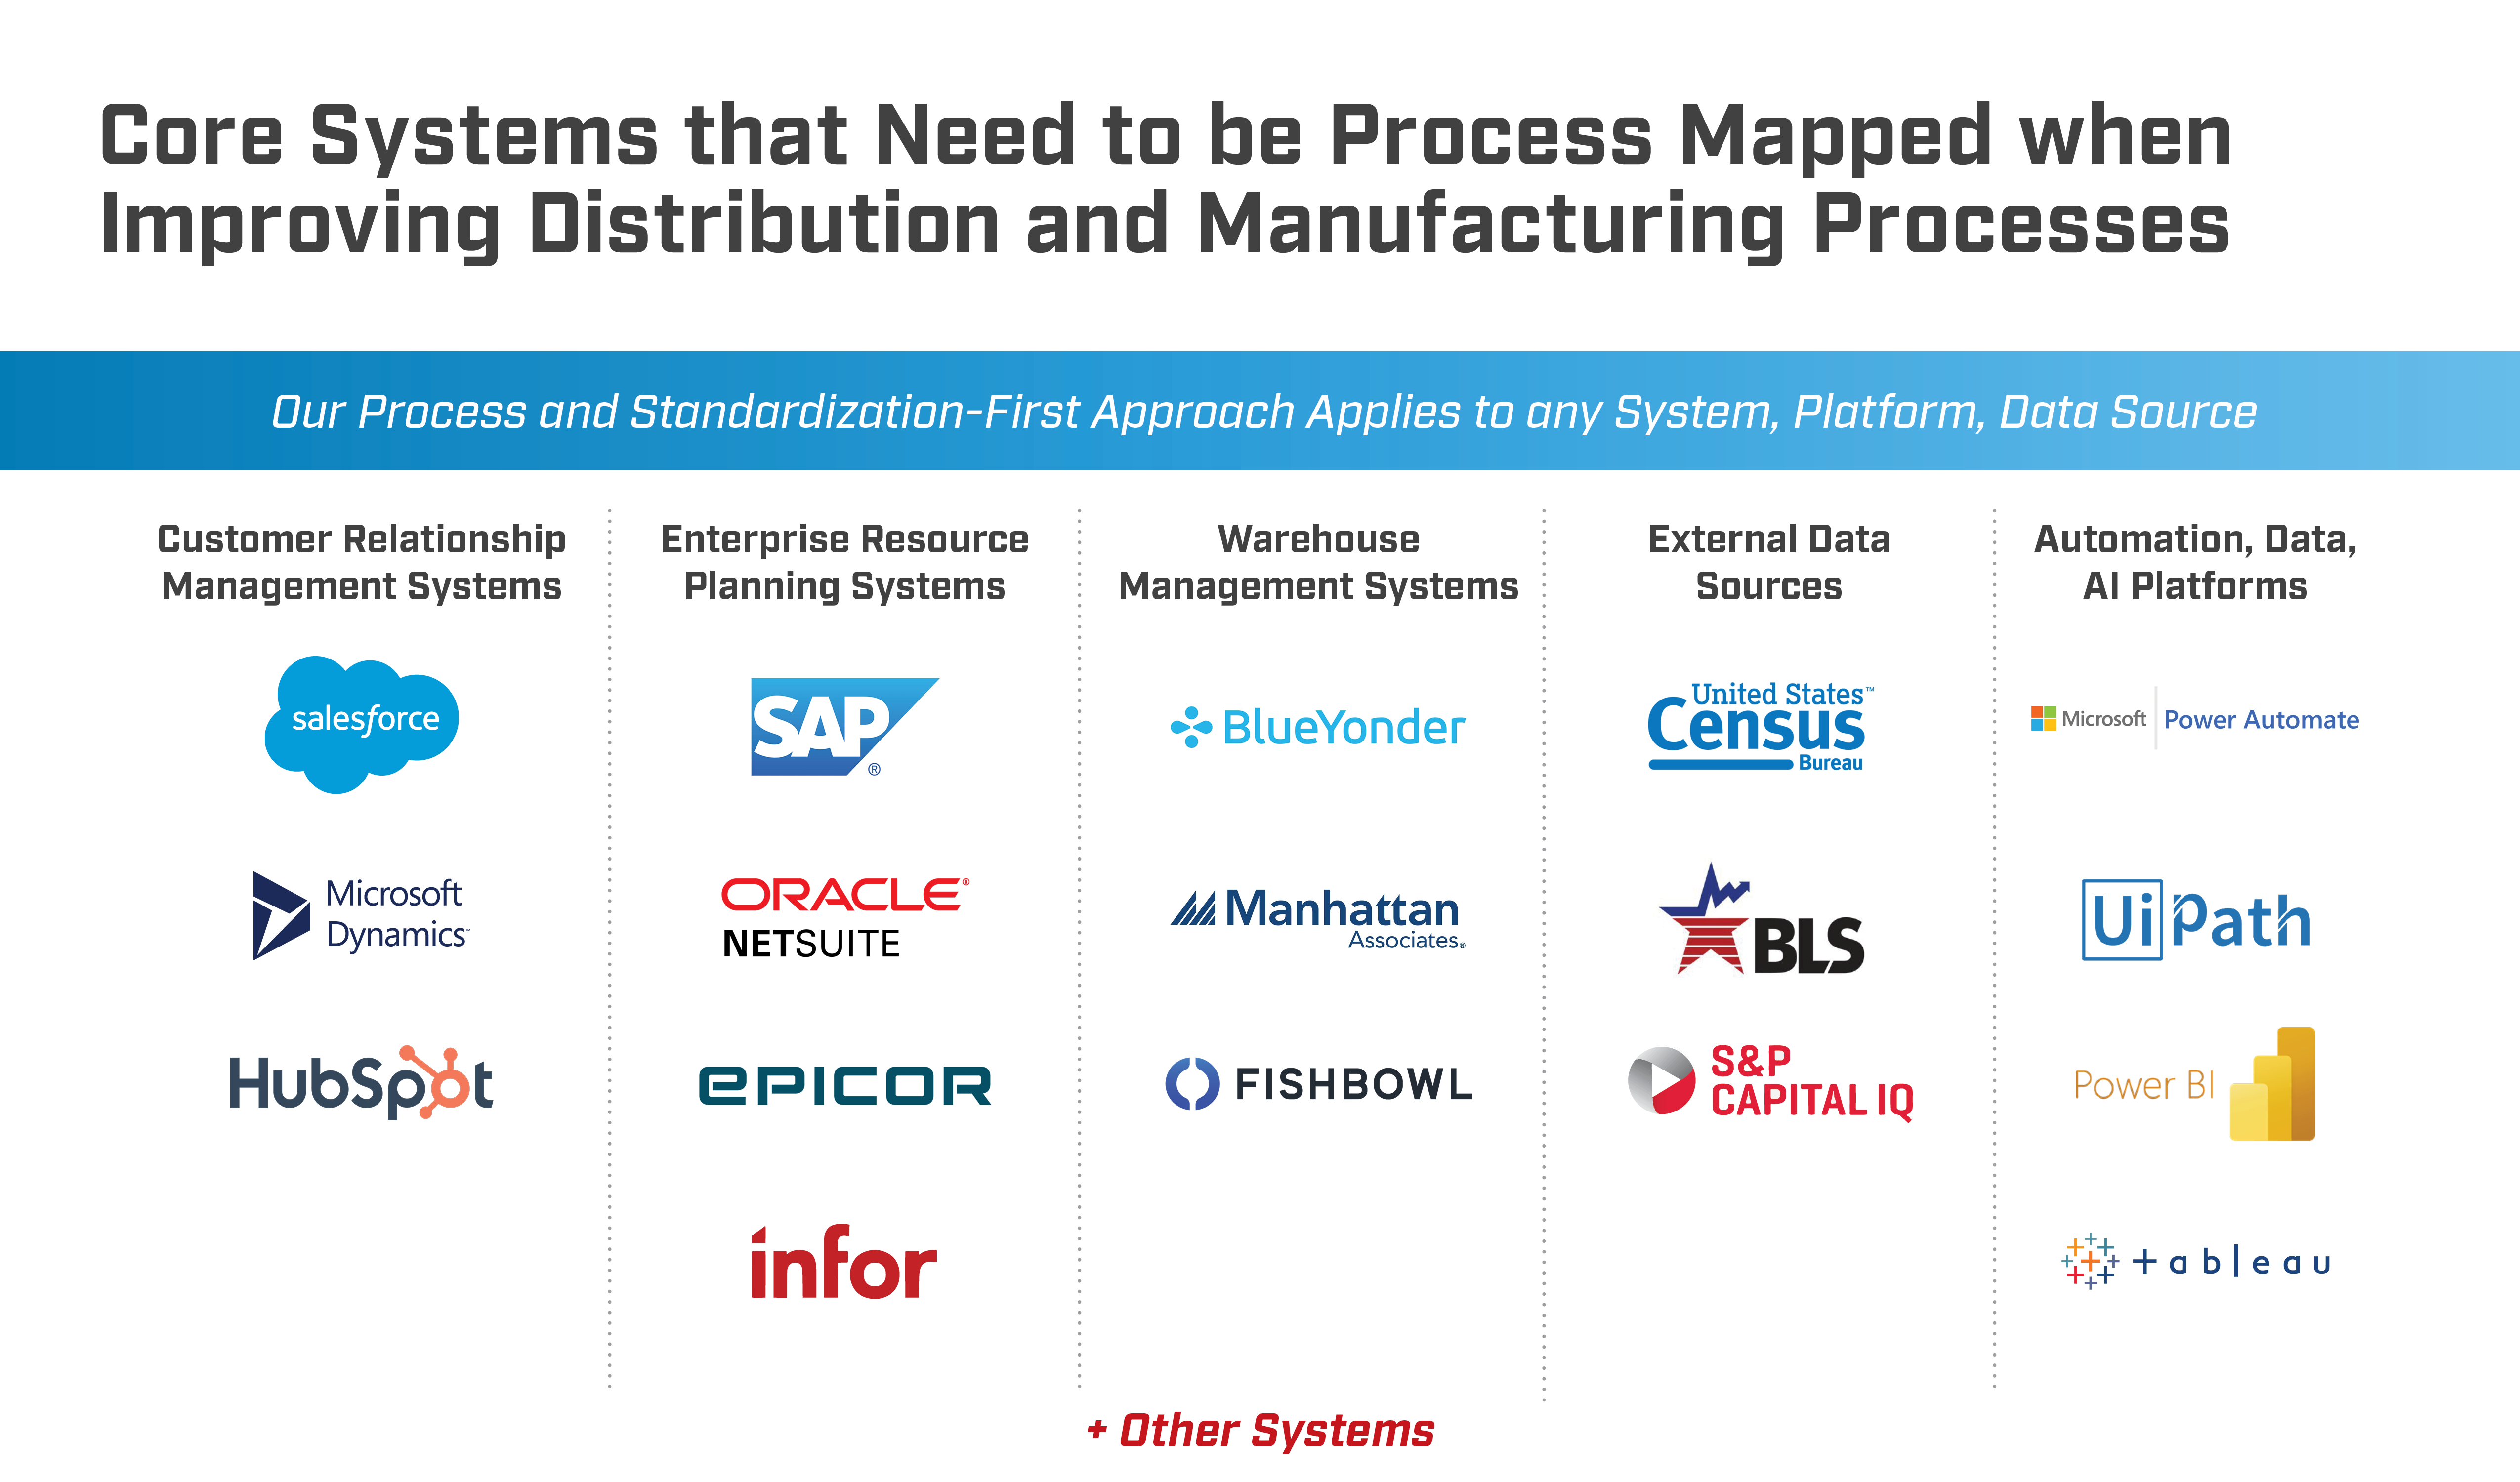
How can you map processes in six to eight weeks?
Here is How The Lab Performs Process Mapping in Supply Chain, Manufacturing, and Distribution
The Lab’s standardized approach to process-mapping, combined with our best-practice templates for future states (not to mention our process-obsessed team) significantly reduce the time required to document and analyze our clients’ businesses.
We build your current-state process maps in just six to eight weeks. We document all business processes, from end to end, at the one- to five-minute-duration level of activity detail. Operations and improvement details are layered atop each map, including job roles, customer touch-points, system use, redundant or wasted effort, automation use-cases, standardization opportunities, and others.
Importantly, The Lab has designed our process-mapping process to make sure that you needn’t “shut down the business to map the business.” Throughout the engagement, The Lab only requires 1 to 2 hours of time, per week, per SME. We you’re your organization is already jammed, just keeping the lights on. So we work hard to avoid being a drag on your team.
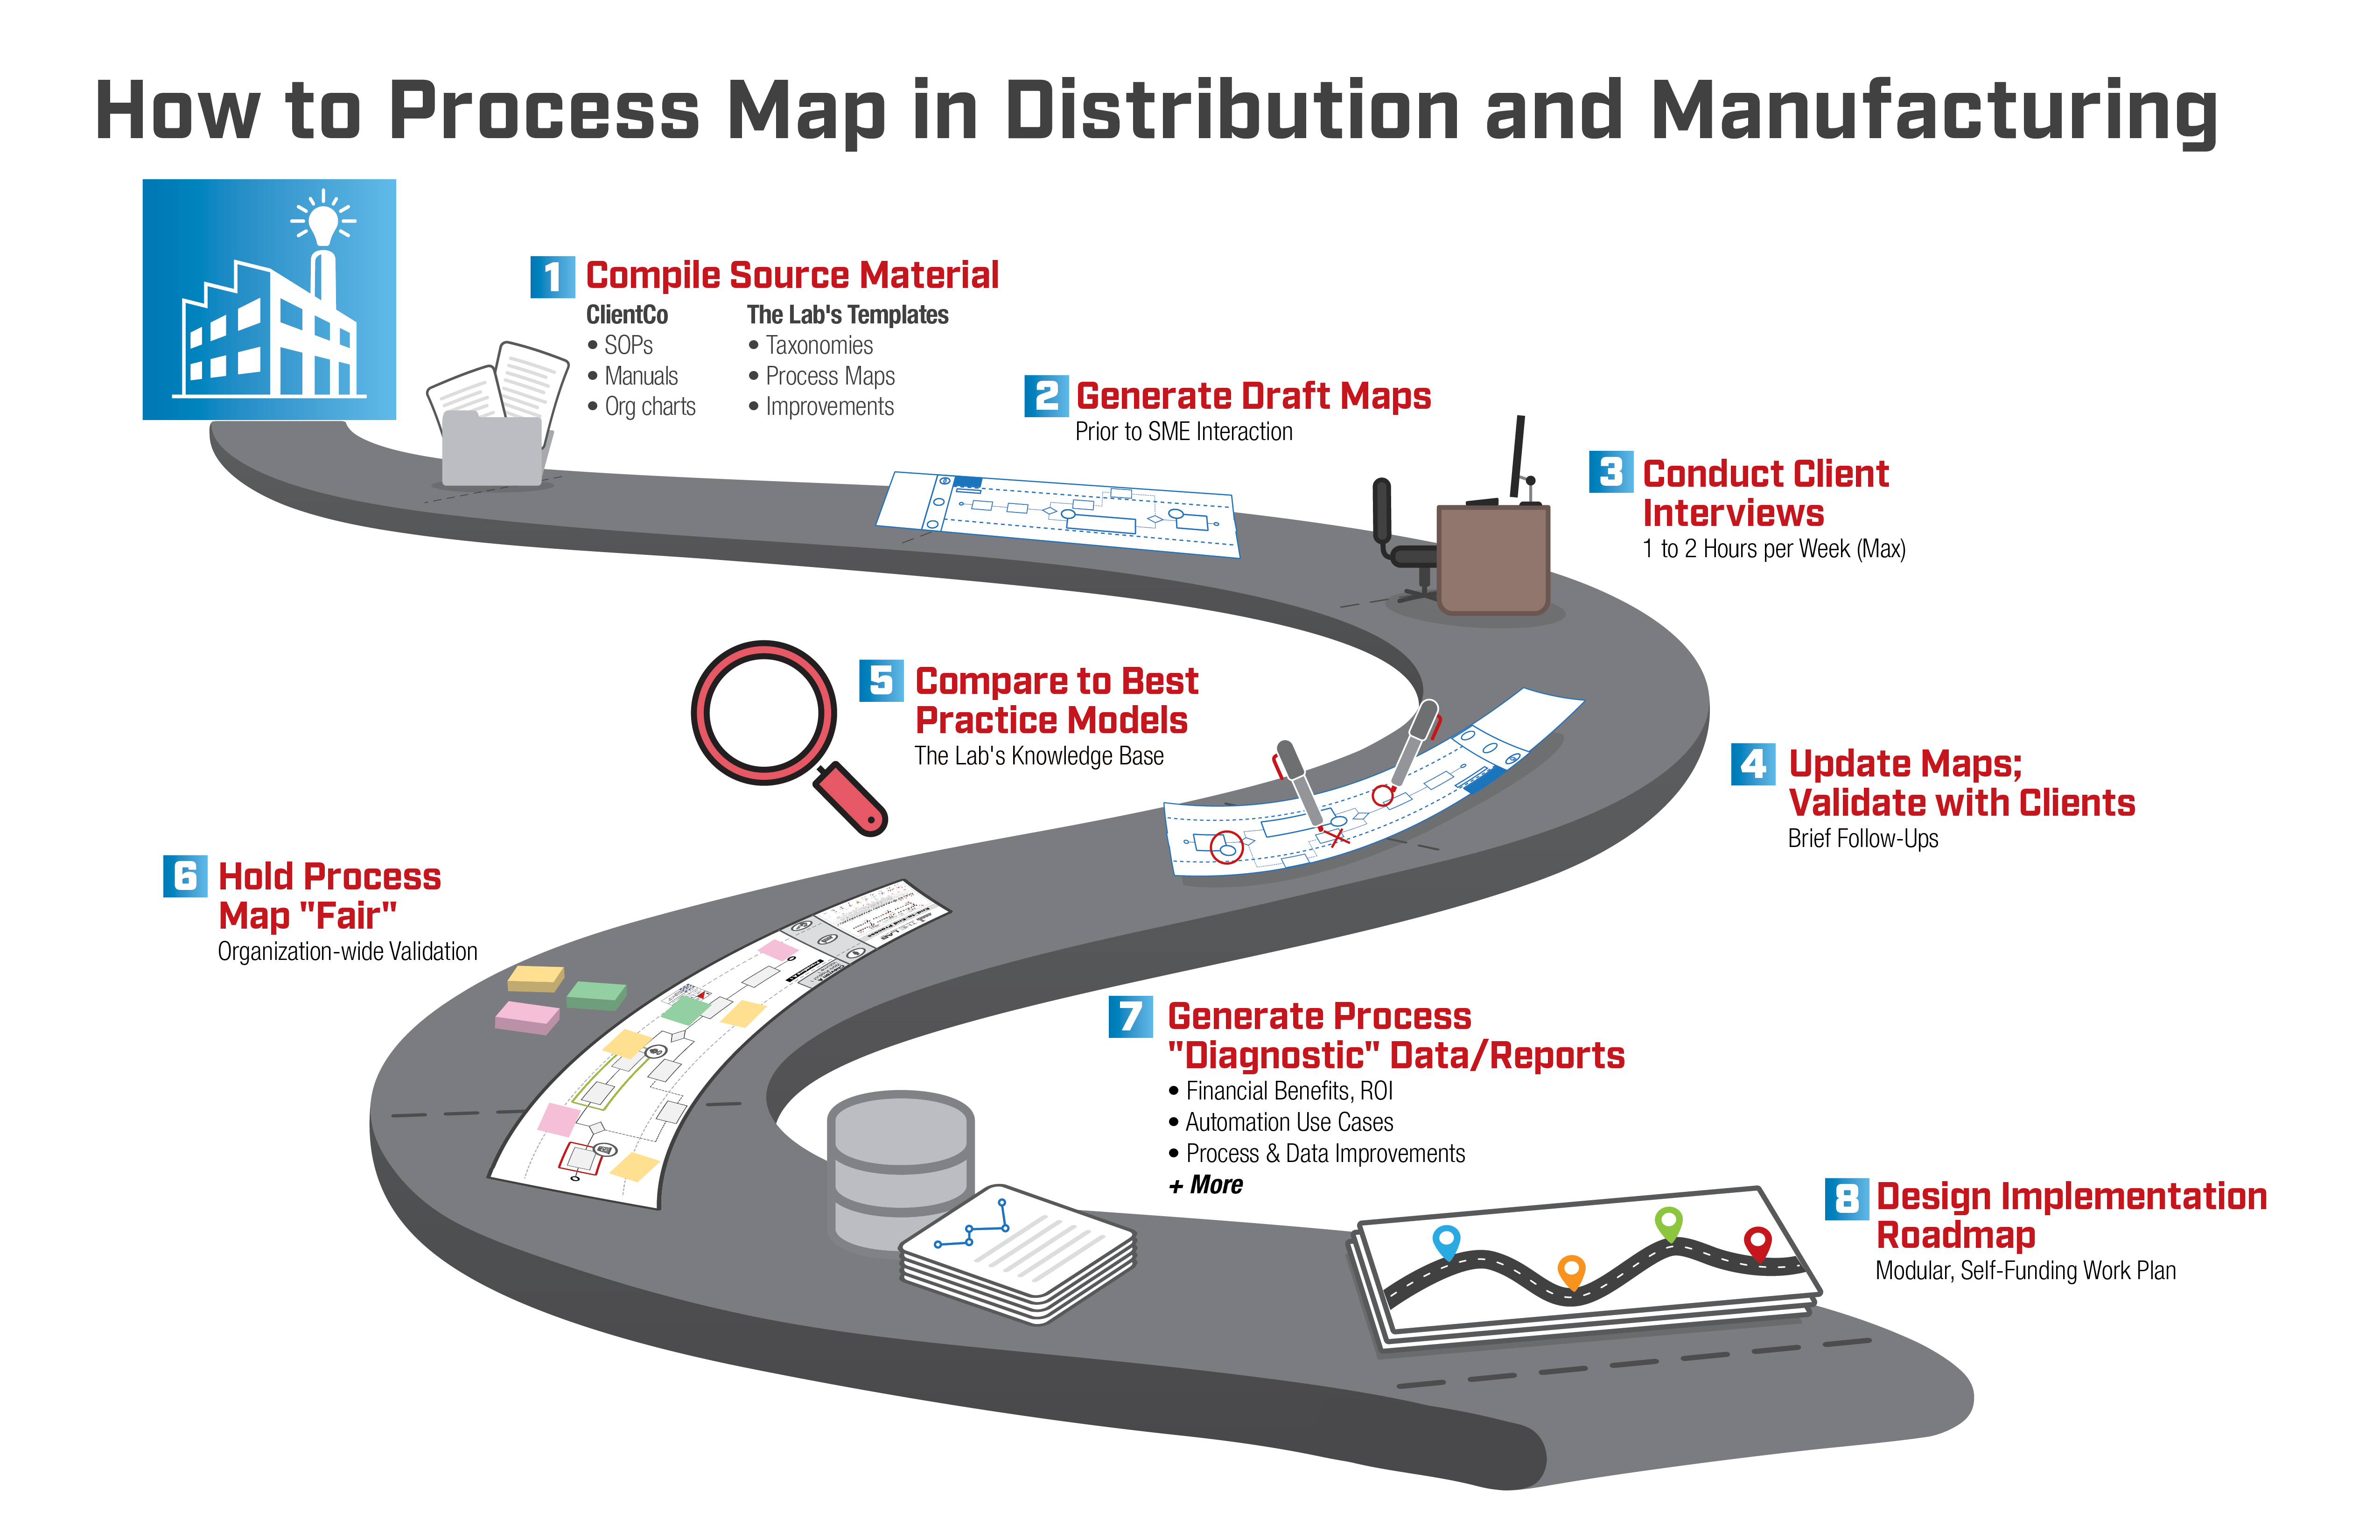 When engaging The Lab for process mapping in your distributorship or manufacturing operation, we will follow this best-practice methodology and cadence:
Step 1:
Collect source material and systems data
When we kick off an engagement, we initially ask that you simply dump all your existing process procedures, manuals, and other information on us. All of it! We don’t care if it’s six years out of date and 40 percent incomplete. The reason is that we want—and need—to analyze all of your previous process documentation. This lets us perform our research before we engage with your teams. What do we want to review? We’ll ask you to share:
- SOPs
- Organization charts
- Policy and procedure manuals
- Operational reporting, even if the KPIs are in sloppy Excels or PowerPoint
In addition to SOPs and all existing process materials, The Lab will require extensive data extracts from all supporting systems. But don’t fret: We only need scrubbed/redacted data, purged of any PII and/or CSI. We neither want nor need customer-sensitive data to find trends of things like:
- Order error rates
- Line-item fill-rates
- Order-to-shipment cycle times
- On-time delivery rates
- Incident rates
- Incident resolution cycle times
…and those are just productivity KPIs. Rest assured that there are plenty of others we’ll help you gain insights on, including improving sales effectiveness and growing gross margins.
The data we collect will be compared to the process maps; this will inform the creation of a current-state capacity model. It will also quantify the improvements for an implementation business case. Remember that, at its core, The Lab is an implementation firm.
While reviewing your current-state materials, we will also compare them to our industry-leading library and knowledge base of previously analyzed processes to begin to plug gaps. Remember, your distribution or manufacturing business isn’t that much different from your peers.
The Lab’s knowledge base contains IP and templates, such as:
- Process maps
- Taxonomies
- Improvements
– Automation use-cases
– Reorg
– KPIs
– Standardization opportunities
– Benchmarks
– Best practices
Step 2:
Draft the initial Version 1 process maps
After The Lab conducts the aforementioned due diligence, we create the Version 1 process maps. Note that all of this gets done before we engage with your subject-matter experts; we want to be as frugal as possible with their time.
Also note that The Lab’s process-mapping layout work is done in Microsoft Visio. We use this readily-available file format so it’s easy to hand off the completed maps, post-project, to your teams for future updating and/or maintenance. Not only that, you won’t need to onboard (and deal with) yet another software vendor. Remember: Regardless of how great our work product is, and regardless of how much our clients love us, no one wants consultants hanging around forever!
Step 3:
Interview client SMEs
After completion of the initial Version 1 maps, it then becomes time for us to engage your frontline subject matter experts (SMEs) who are performing the day-to-day tasks in manufacturing or distribution. Using MS Teams or Zoom, we show them the Version 1 maps. We then pose pointed questions about the gaps that we perceive in the process; we also work with them to build out further details. This activity only requires an hour or two per week with the SMEs. Again, we want to be extra respectful of their time.
Step 4:
Iterate the maps; validate them with clients
After the first round of fact-finding/process-mapping with your team, we iterate the maps over the course of four weeks, employing a lather-rinse-repeat cadence to build out further map detail. What we have found, in our 30-plus years of experience, is that no one can ever remember every single step of a process in one sitting. That’s why we come back multiple times, in short bursts over several weeks. This approach builds out the best level of detail that the organization can them improve upon.
Step 5:
Use peer organizations and The Lab’s best-practice knowledge base for comparison to clients’ process maps
Once we complete the drafting of the current-state process maps, The Lab compares the clients’ process maps to industry best-practice models and peer comparatives. This is integral to building out the most valuable future state for implementation.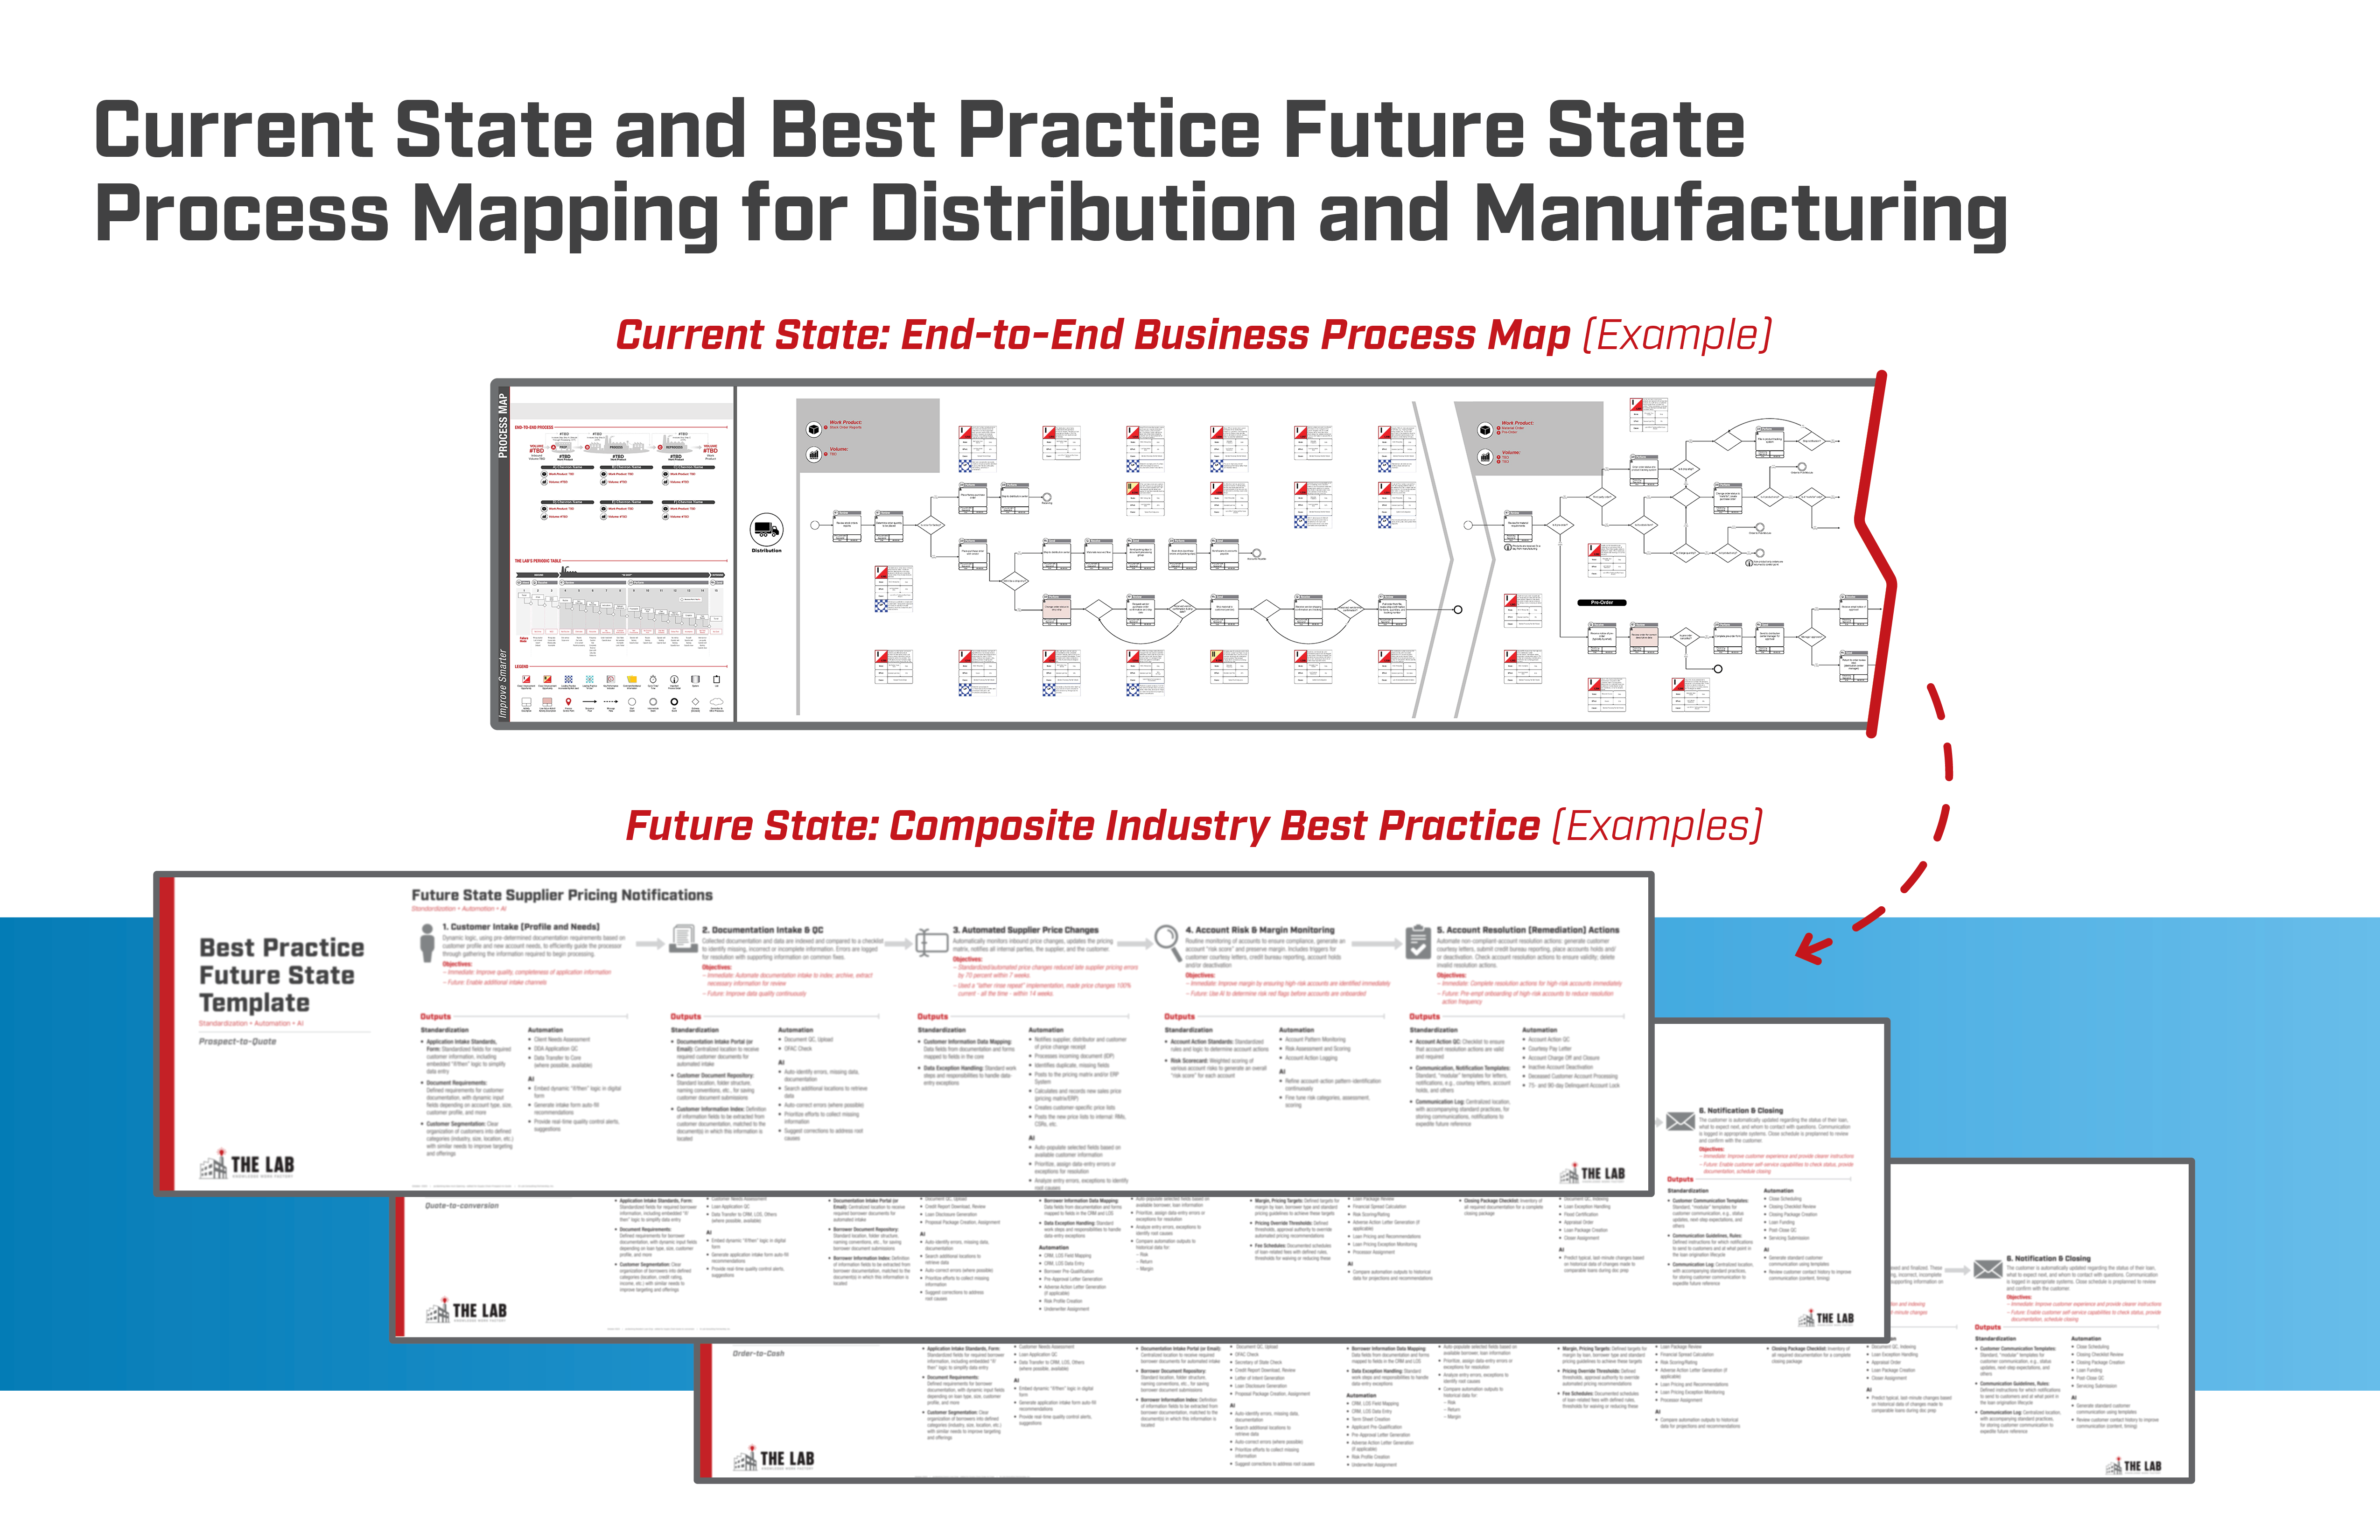 The Lab’s knowledge base and best-practice models contain:
- Best-practice process improvements
- Use-cases for automation
- Key Performance Indicators or KPIs
- Benchmarks
- Job/role descriptions
- Process and data-standardization opportunities
- Reorg opportunities
Step 6:
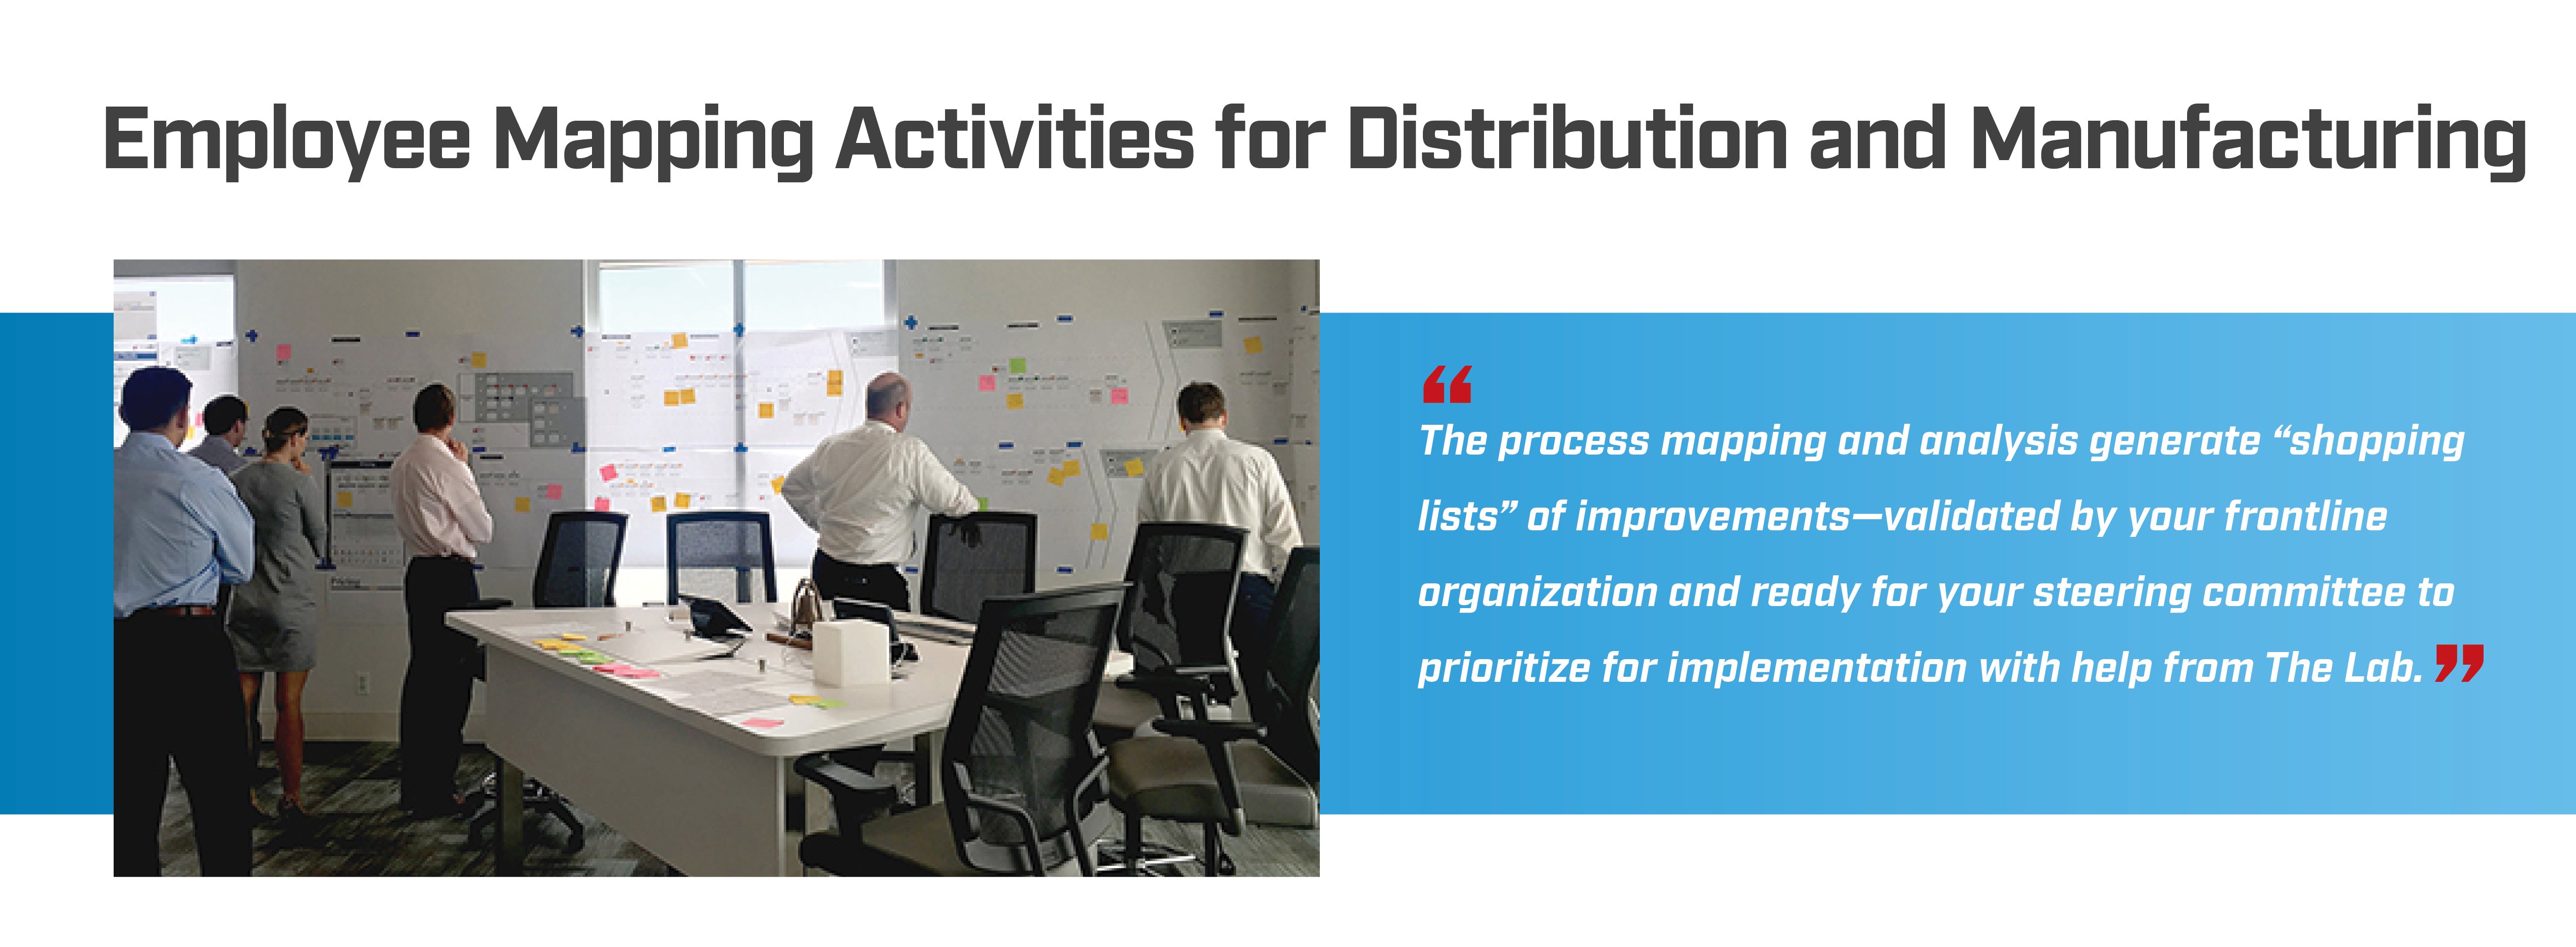
Conduct a process Map Fair for organization-wide detail and buy-in
At this point, all of the initial process-mapping, generation, and validation activities are complete. Now it’s time for The Lab to present the printed-out process maps to the entire organization. These “Map Fairs” are held in person, typically staged in common areas in the organization’s headquarters. This makes it easy for your manufacturing or distribution staff to visit at their leisure throughout a two-day period.
Map Fairs allow your team members to contribute anonymously (if they prefer), which further validates the process fact-base that the organization has helped create. The Map Fair also shares process-mapping findings, while preparing the organization for upcoming process change. The Map Fair creates buy-in because everyone has an opportunity to contribute. Organization team members are encouraged to mark up the map with color-coded Post-it’s:
- Green: “I strongly agree.”
- Yellow: “There’s missing info” or “There’s an additional process step or improvement that should be added.”
- Red: “I strongly disagree.”
After the Process Map Fair, The Lab analyzes all Post-it note contributions, and reconciles them into a final version of the workflows. At this point, the maps are considered final—and ready to put to use (see below).
Step 7:
Craft the capacity model; create “diagnostic” process-data reports
Once the two-day Map Fair is done, there will be hundreds of improvements available, thanks to the Fair’s final validation, analysis, and buy-in. These are the types of improvement opportunities we typically see among distributors and manufacturers:
- About 150 to 250 opportunities for standardization
- About 100 to 200 use cases for automation
- And about 50 to 100 use cases for analytics
The Lab will then migrate these into a navigable, centralized database. We will also create a dashboard, in MS Power BI, which can be used to visualize, prioritize, and plan which opportunities should be implemented, and in what order.
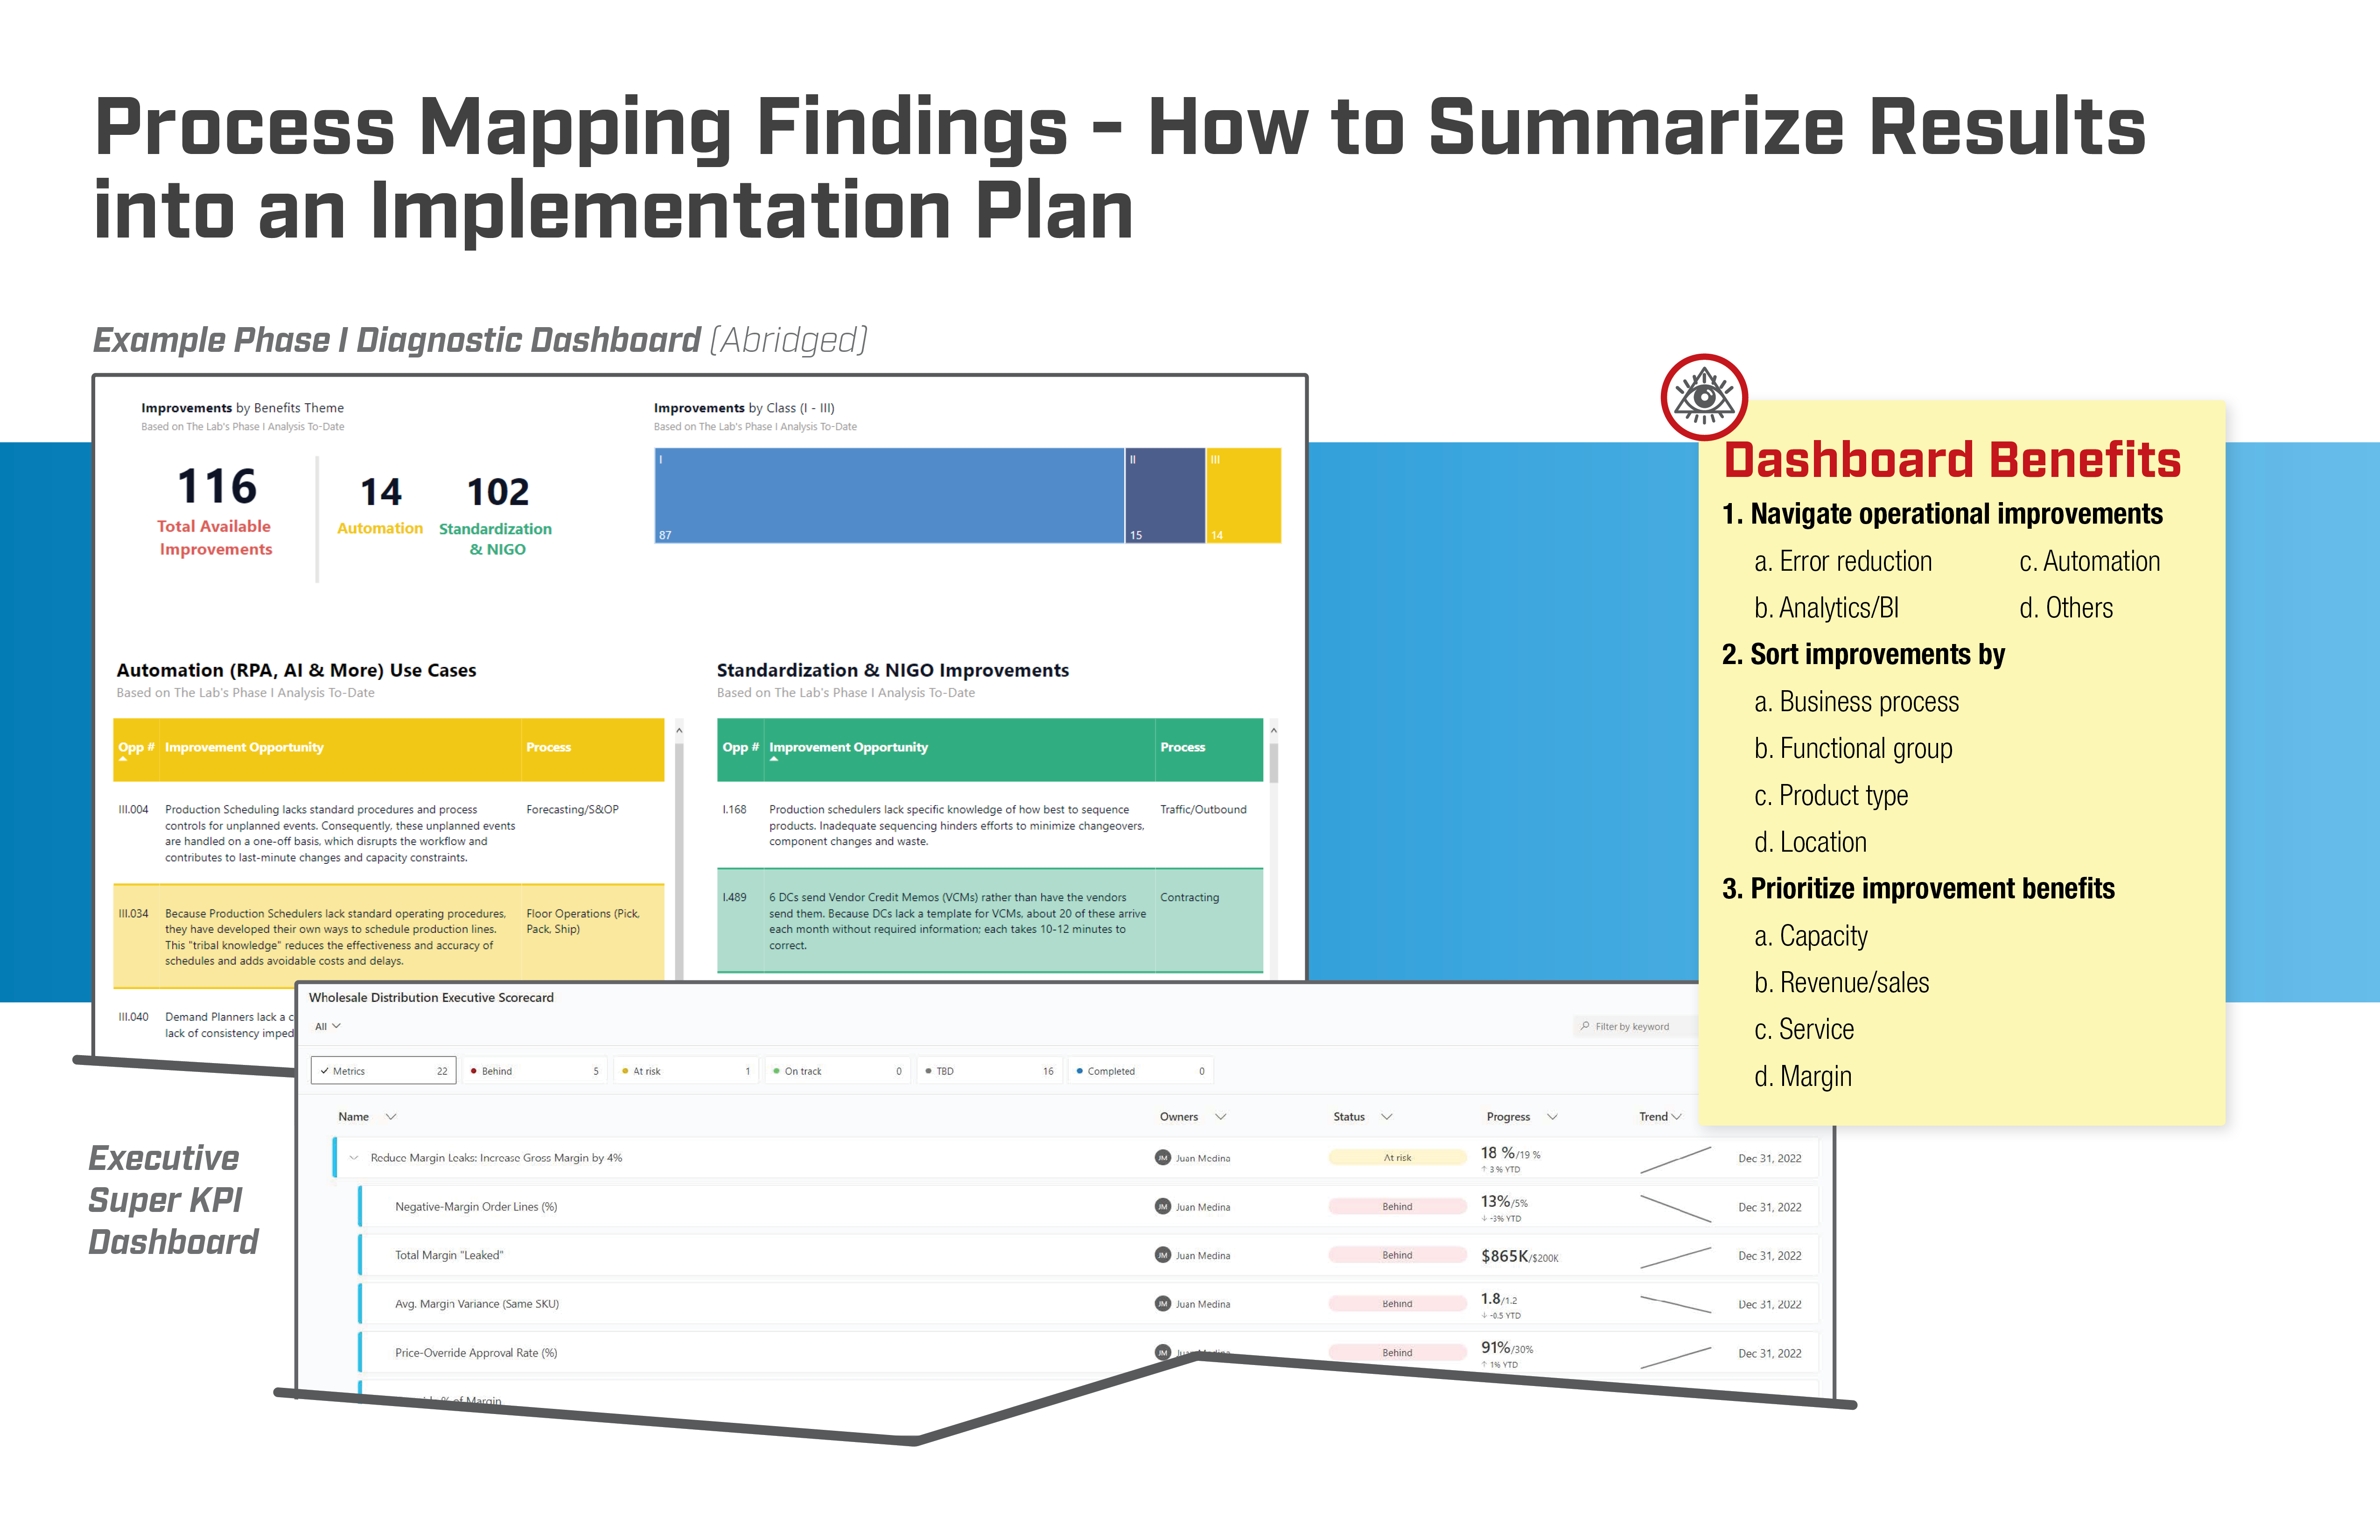 Each of these improvement opportunities and use cases will be quantified in terms of their financial benefits, the time they save, the customer-experience improvement they deliver, the technology under-utilization they spotlight, and others. After we compile and quantity the individual improvements, The Lab can then generate a comprehensive organization capacity model. This will function as the baseline for calculating the business case and value of implementation, work plans, and modules.
Outputs include:
- Financial benefits and ROI
- RPA automation use cases
- Process and data improvements
- Others
Step 8:
Map out the implementation schedule
Regardless of how sophisticated your distribution or manufacturing operation may be, it’s simply not possible to implement all of the identified improvements in one shot. While that may be tempting, it’s unlikely to succeed.
Over the years, The Lab has learned that our manufacturing and distribution clients are far better off making small, “bite-size,” modular implementation plans that align to short/mid/long-term strategy. That’s because a continuous-improvement approach will always yield more longer-term benefits than a short-term all-in-one attempt. Working with the client, The Lab helps to implement in the beginning; by the end, the clients are able to implement on their own.
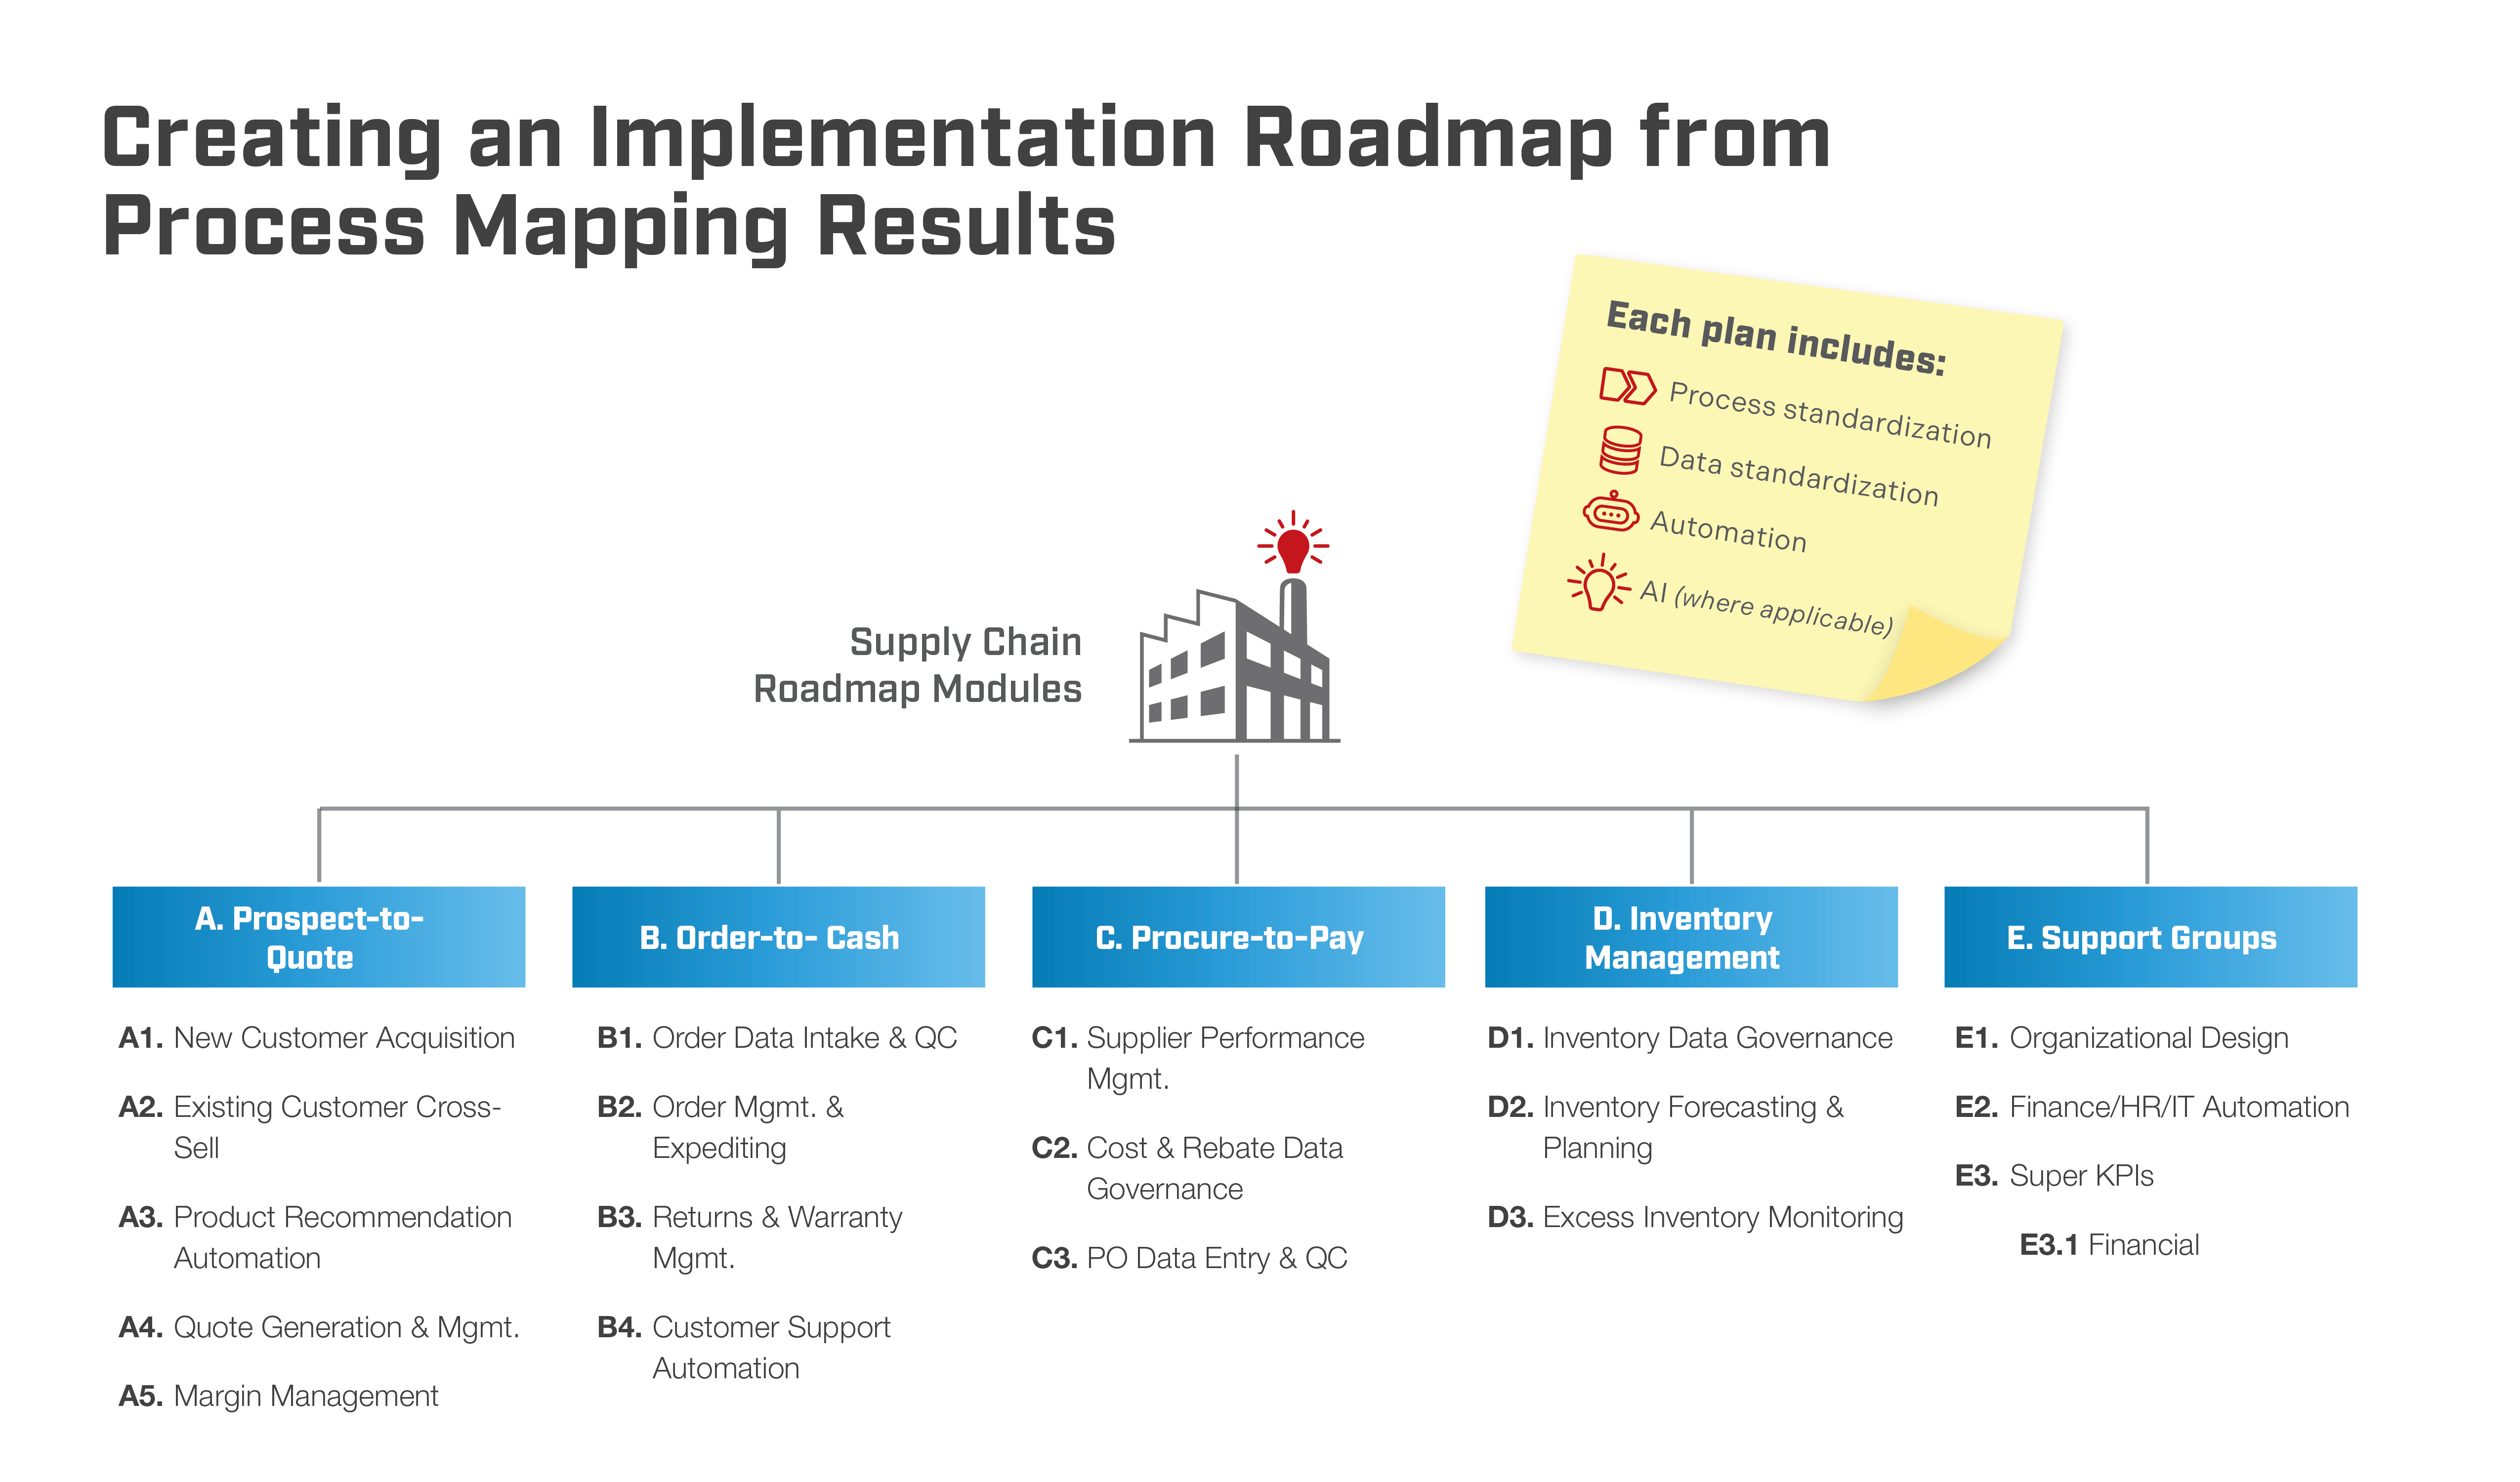
Outputs from this step include:
- A self-funding modular work plan
- Scheduling slated by business-calendar quarters
- Optimum mix of process improvement, RPA automation, and KPI-based analytics
- Jointly designed by The Lab and executive steering committee to meet the manufacturer’s or distributor’s strategic objectives
An exception to the rule: Some business situations truly warrant a big-bang approach. The Lab has supported some of the world’s largest reorganizations in these challenging events as needed.
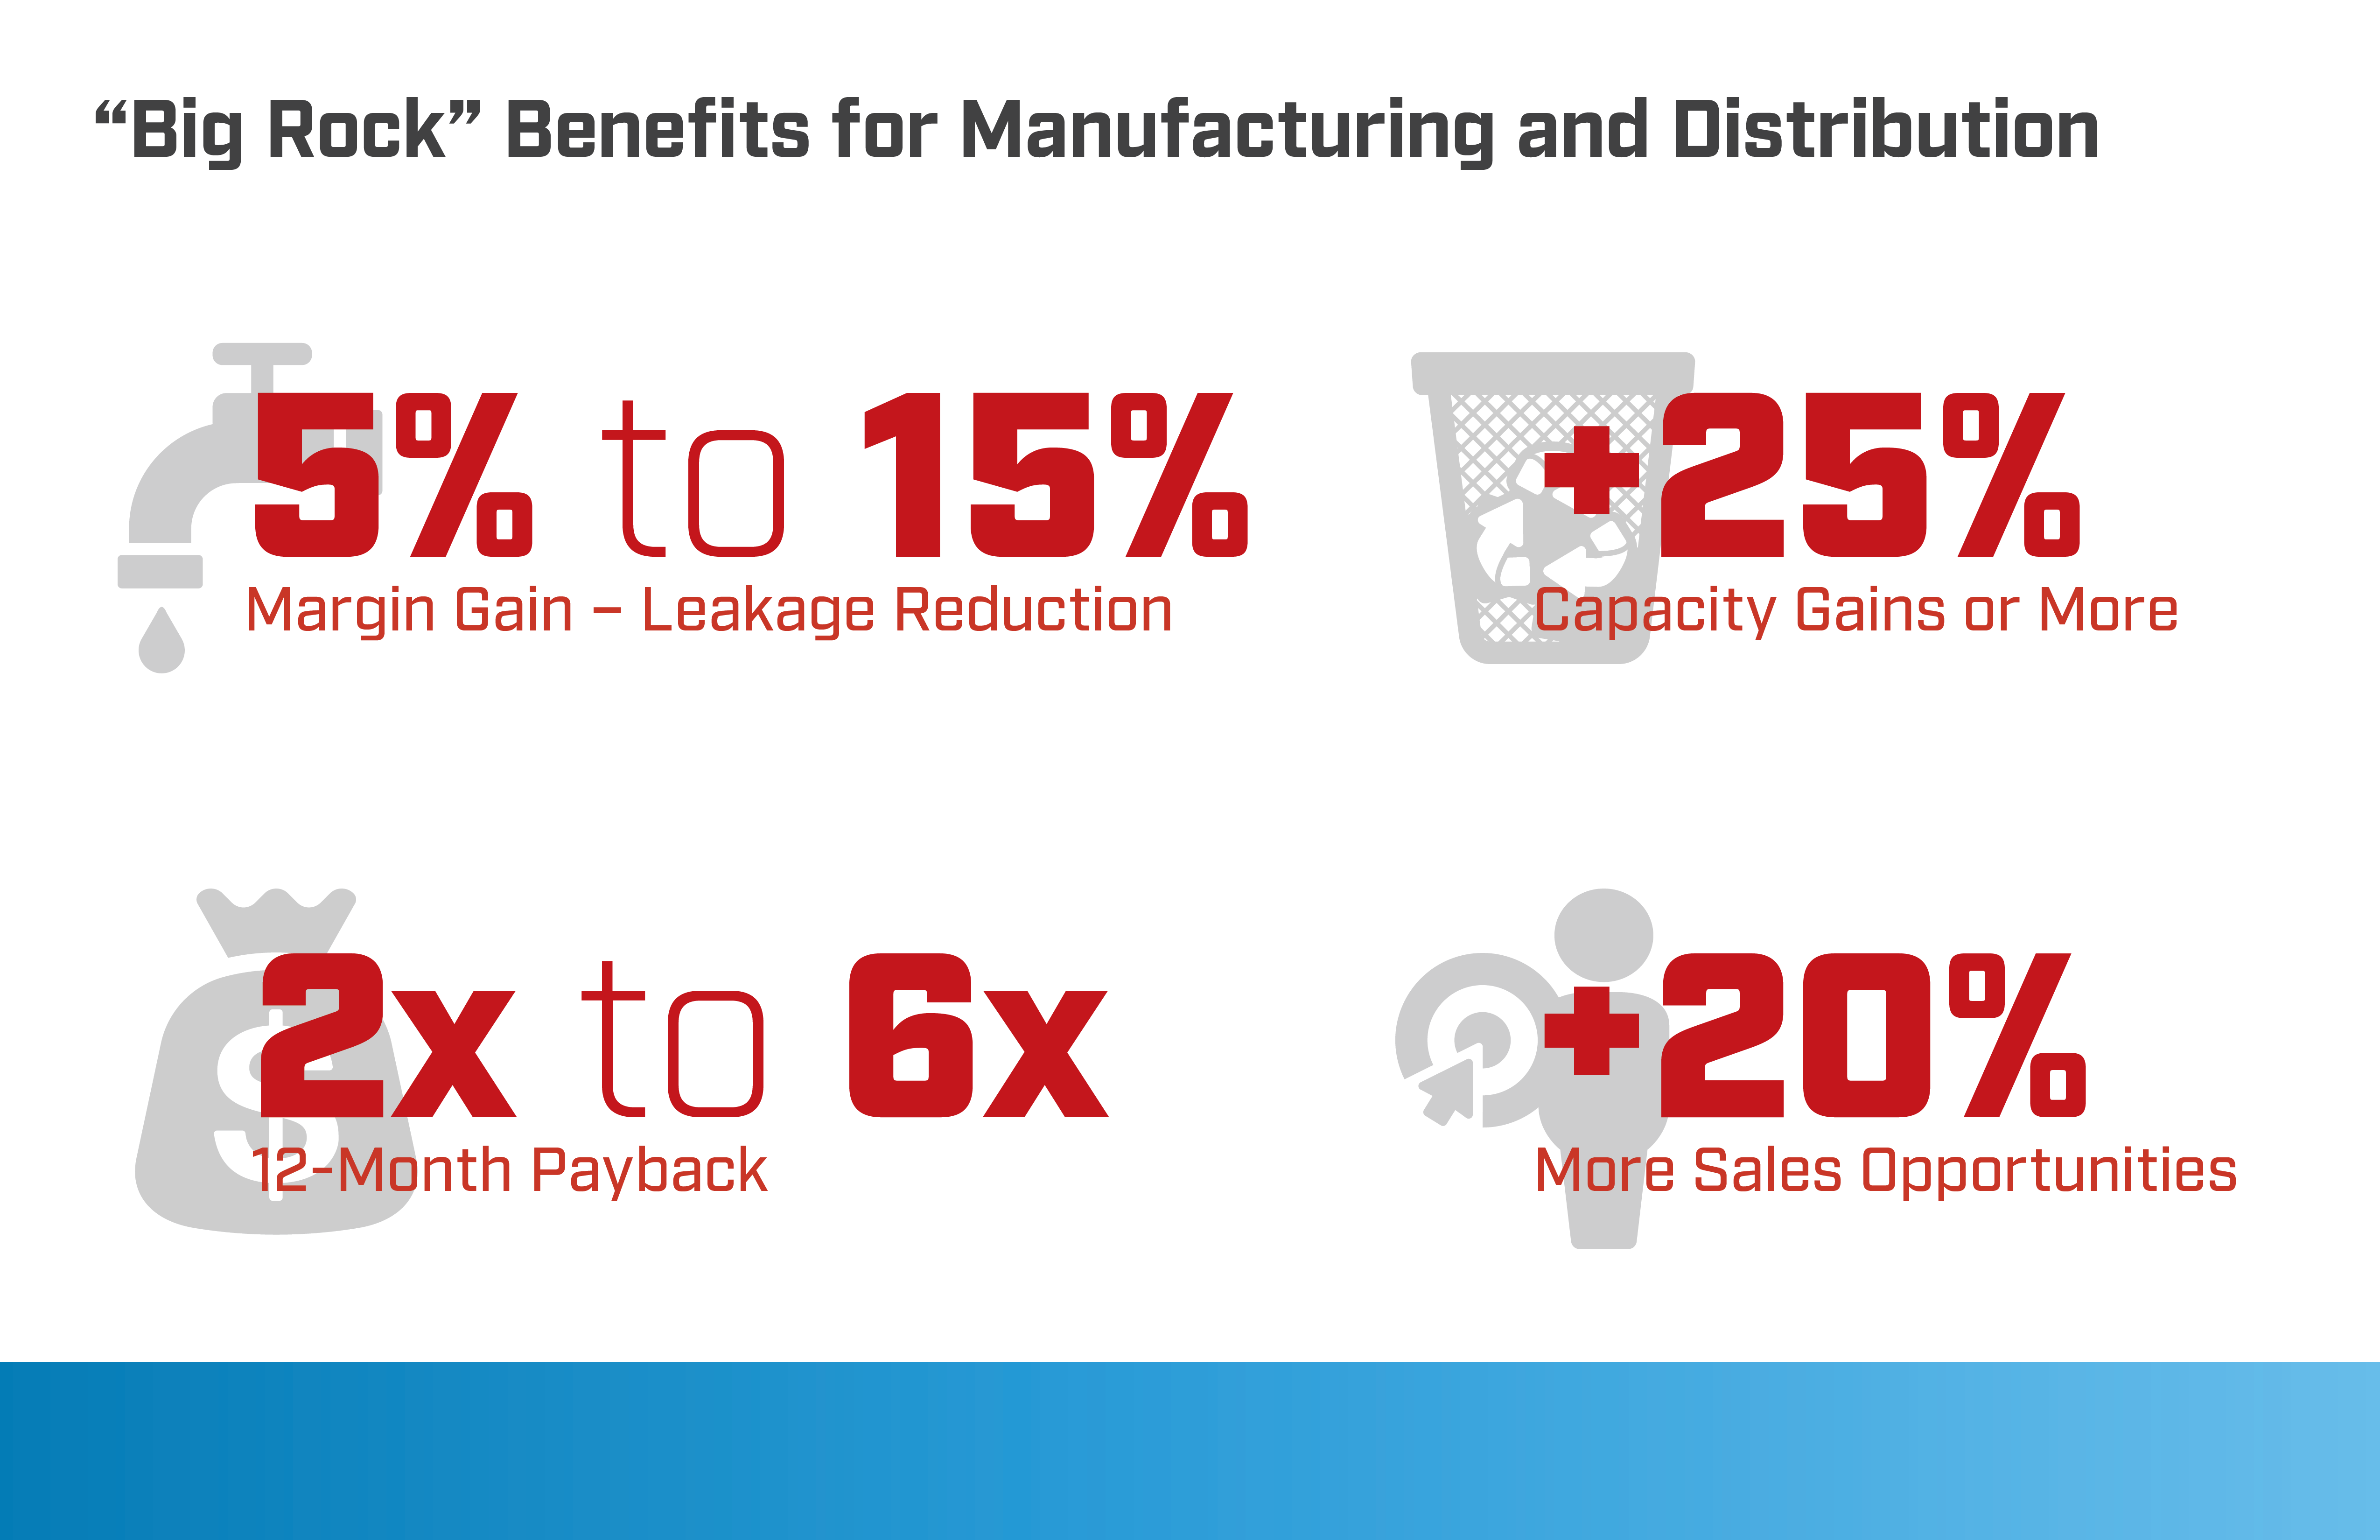
Improved operational efficiency; enhanced cost savings
Top benefits from process mapping in manufacturing and distribution
TRANSFORM YOUR DISTRIBUTION OR MANUFACTURING OPERATION
Contact us today to book your demo!
The Lab has helped distribution and manufacturing C-suite executives, business-unit and technology leads, as well as internal improvement teams to map out all of their organizations’ business processes and customer journeys. We’ve helped them to streamline their operations, increase customer satisfaction or CX, and achieve substantial cost savings. We both identify and implement RPA automation opportunities and advanced analytics. These improve process resiliency and hedge against employee turnover. Our comprehensive solutions deliver measurable results and drive success.