Supply-Chain Business Data & KPI Standardization: A How-To
Learn how to layer agentic AI, predictive analytics, data intelligence, automation, and Executive KPIs™ into your supply chain business
· Benefit: Earn 2 to 5 points of added margin on new business
· Benefit: Increase supply chain performance at least two-fold
· Benefit: Align capacity with needs; reduce costs 21% – 36%
Your Data May Be Centralized, But Is It Standardized?
Why supply chain executives must move beyond centralization to unlock real operational value.
As a supply-chain C-suite executive (or tech leader or part of an internal improvement team), you know that your business is sitting atop tons of data from all your different systems, including:
- ERP or enterprise resource planning, from vendors such as SAP, Oracle, and NetSuite
- TMS or transportation management system, from vendors such as Blue Yonder
- SCP or supply chain planning & optimization, from vendors such as SAP IBP and Kinaxis
- WMS or warehouse management system, from vendors such as HighJump and Manhattan Associates
- SRM or supplier relationship management systems, from vendors such as SAP Ariba, Vizibl, Kodiak Hub, Coupa, GEP SMART, and plenty of others
You also recognize the value in that data. Likely, you’ve begun aggregating those systems-specific data stores into a central repository or data lake — and that is a meaningful first step.
But it is only the first step.
Most supply chain executives understand the need to centralize data, a lot of them underinvest in the follow-up requirement: standardizing that data for downstream automation and AI consumption.
This article outlines why standardization — specifically structured for automation, predictive analytics, data intelligence, Executive KPIs, RPA and agentic AI — produces operational advantages that can be measured:
- Supply chain executives and frontline managers—will be able to “query operational data, and get actual answers in return… in plain language.” And that’s in real-time. The ad hoc report requests and the burden of interpreting those reports becomes largely unnecessary.
- Decision-relevant insights are surfaced automatically or on demand, triggered by pre-set intervals or KPI thresholds, drawn specifically from your supply chain business data.
- Automation scope expands, enabling more tasks than ever to become automatable resulting in cascading benefits.
The Lab’s unique IP Knowledge Base includes pre-built templates of:
- Data standardization models for supply chain
- Advanced analytics data intelligence dashboards
- Agentic AI
- Automation (even bot code)
- Best practices
- Industry-specific KPIs for executives and management
Taken together, these help our executive sponsors in supply-chain enterprises to attain performance improvements of anywhere from 2 times to 5 times their current levels.
Four Capabilities Your Supply Chain Operation Can Unlock
What new capabilities can your supply chain operation achieve from standardized data, advanced analytics, and executive-focused KPIs?
Upfront effort is required by preparing your data to deliver these capabilities — however, the operational return justifies the effort. The capabilities listed below become available when your supply chain data is structured to support analytics, AI and automation:
- Supply Chain Capability 1: Market/customer analytics. See real market trends and customer behaviors, grounded in your supply-chain customer data. Shine a spotlight on opportunities to improve revenue, and customer experience, at every single stage of the Supply Chain Operations Reference or SCOR model, including Plan, Source, Make, Deliver, and Return, depending on the phases your business includes.
- Supply Chain Capability 2: Region/warehouse/network analytics. See performance at the warehouse, or regional level; drill down to the individual employee level. Uncover root causes of bottlenecks; get detailed solutions served up to you, automatically and proactively.
- Supply Chain Capability 3: KPIs for executives. Executive KPIs from The Lab represent the top-level essentials which reveal the “state of the union” for your supply chain operation. These pave the way for the fourth capability:
- Supply Chain Capability 4: KPIs for managers. At the management/operational level, these empower your teams to use them daily; like all KPIs from The Lab, they’re instantly drill-able and automated, too, serving up insights, issues, and solutions via pre-defined triggers and/or time intervals.
The bulk of this long-form executive explainer article from The Lab covers those four capabilities, in greater detail. We’ll also talk about The Lab’s Standard Data Model — the underlying framework that makes them possible.
The Lab’s standard data model operates on top of existing infrastructure requiring no systems migration or replacement. Our system connects with all your system- and platform-specific supply chain data sources, which means that a centralized data lake or warehouse is not required for implementation.
Let’s now discuss those four data-enabled supply-chain capabilities in detail.
Supply Chain Capability 1: Market/Customer Analytics
Use “navigation tools” to increase market visibility and sales.
With “navigation tools” from The Lab, you can get instant insights into vital sales and marketing related questions, such as:
- Which customers produce the most profits
- Which products and supply-chain services drive the highest profit margins
- Which supply chain products and services are ideal for “cloning”
- Ways to up-sell the most profitable accounts
- More
What is a “navigation tool” from The Lab? It’s a simple click-to-operate interface that provides an easy and intuitive means to drill-down to arrive at insights like those noted above. Now imagine having all of that automated for you, whenever you desire. That’s what the four navigation tools, detailed below, deliver. Never wait for the next annual strategy session again.
(Images)
Supply chain profitability navigation tool. This automated navigation tool for supply chain leaders from The Lab delivers insights such as: “Your top 9% of products are responsible for upward of 84% of net margin.” This navigation tool:
- Calculates exact supply-chain margin for each account
- Sorts profitability by customer, by service, by product, and so on
- Gives a report-card-style letter grade for profitability
Supply chain performance in market share navigation tool. Up-sell and/or cross-sell better, using the information from the other navigation tools from The Lab. This navigation tool will:
- Identify which specific products or services to cross-sell or up-sell
- Show current market share information and growth
- Identify the top opportunities for competing
Supply chain customers navigation tool. Want insights on the order of “The upper 8% of your supply-chain customers are responsible for > 91% of net margin”? This is the navigation tool you’ll use.
- Segment your supply-chain customers via geography, demographics, and firmographics
- Spotlight targets for cross-sales
- Develop contact lists that are ready to use for sales and marketing
Supply chain prospects navigation tool. One tier above the lowest-hanging fruit among your existing customers, identify the lowest-hanging fruit among all-new prospects:
- Shows which new prospects conform to your defined geographic, demographic, and firmographic requirements
- Like the supply chain customers navigation tool, this navigation tool also develops contact lists that are ready to use for sales and marketing
Supply Chain Capability 2: Region/Warehouse/Network Analytics
Optimize your supply chain network based on real-time data.
As noted earlier, this capability lets you visualize performance at the warehouse and regional level, with the ability to drill down to the individual employee level, uncover root causes of bottlenecks, and receive detailed solutions automatically and proactively. For example:
- A warehouse manager in the Midwest at an interstate corridor/connection will want to staff his warehouse a certain way.
- A different warehouse manager, let’s say in the metro Tri-State Area in northern New Jersey, will have completely different views when it comes to staffing.
While you want to respect their opinions, you also want an apples-to-apples comparison of performance data—information that will let you max out the productivity of every warehouse and region… and your entire network.
Watch it in the real world. Check out this 4-minute video from The Lab, showcasing Wholesale Distribution Executive KPIs: AI + Automated Data Standardization, Reporting & Improvement.
Consider these rapidly deployable, template-based advanced analytics for supply chain leaders from The Lab:
- Region/warehouse performance analytics. Compare different regions, and different warehouses, across your supply-chain network. See the impact of different markets and demographics.
- Warehouse scorecard. This powerful analytics dashboard from The Lab provides color-coded letter grades of warehouses that fall below—or rise to—best practice. Identify new markets for entrance.
- Warehouse staffing analytics. The warehouse staffing model uses AI to generate recommended staffing levels for each warehouse across your regional network. You can even “adjust the sliders,” to see how staffing needs track with projected or historic growth trends.
- Operational hours supply chain analytics. See worker productivity at each branch or warehouse, with daily and hourly breakdowns, to optimize your supply chain hours of operation, improve productivity, and/or reduce cost.
(image)
Supply Chain Capability 3: KPIs For Executives
How do you choose from more than 500 supply chain KPIs?
The Lab publishes a KPI Handbook for Supply Chain Distributors & Manufacturers containing industry-specific definitions for more than 500 supply chain KPIs, all taken from The Lab’s Knowledge Base. It includes metrics arranged by process, such as prospecting/sales, order-to-cash, and others, all arranged by:
- Cost
- Volume
- Quality
- Productivity
- Revenue
- Organizational benefit
- Service
But “500” is a big number if you’re a C-suite executive who subsists largely on executive summaries. This is why The Lab also offers a more concise offering of Executive KPIs for Supply Chain Distributors & Manufacturers.
Each includes its definition and formula, and all are organized to facilitate their use by managers, too. In other words, the formulas can be employed to create these KPIs from any source of supply-chain data you already possess.
(Image)
Automated insights
How can you ensure that management gets the insight they need, when they need it, from these metrics? The top two levels of the resulting KPI dashboards from The Lab are automated. Once triggered (by a shortfall or overage of a KPI it’s monitoring), the dashboard will send out not just an alert, but recommended corrective actions to the appropriate managers.
The automation:
- Pinpoints all sources of supply chain variance
a. Customers
b. Products
c. Regions
d. Branches
e. Warehouses
f. Employees - Identifies all root causes across the supply chain as applicable
a. Erratic follow-up
b. Poorly priced deals
c. Sub-quality prospects
d. Process bottlenecks, failures, delays - Preempts future supply chain issues
a. Automates all required follow-ups
b. Updates supply chain pricing standards as needed
c. Defines rules for proper prospect prioritizing
d. Cuts down on upstream document-collection issues
Executive and Management KPIs are not siloed from one another. Each dashboard connects to actual best-practice improvement actions that frontline managers and their teams can act on — freeing executives from the data validation cycle that typically precedes any resolution discussions.
Want to witness this kind of supply chain data analytics in action? Watch this 4-minute video, entitled “Wholesale Distribution Executive KPIs: AI + Automated Data Standardization, Reporting & Improvement,” from The Lab’s YouTube channel… specifically, our Supply Chain, Distribution & Manufacturing Analytics video playlist.
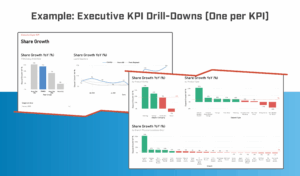
How do you build an Executive KPI for a supply chain enterprise?
- Review your extant executive-level supply chain reports
- Create top-layer executive scorecard
- Review the portal structure & design for supply chain Executive KPIs
- Layer in the v1 data for the selected supply chain Executive KPIs
- Publish the v1 KPIs for executive UAT or “User Acceptance Testing”
- Update v1 to v2 to include UAT feedback
- Populate the other supply chain Executive KPIs and their respective drill-down items
- Distribute user guides/documentation
Supply Chain Capability 4: KPIs For Managers
Understanding management KPIs and their usage in supply chain operations.
Remember the 500-plus supply-chain KPIs we’d mentioned in The Lab’s popular KPI Handbook for Distributors and Manufacturers? Also remember the “more concise offering” of the vital few Executive KPIs mentioned in that discussion? Well, a similar situation exists when it comes to template-based KPI dashboards for supply-chain managers, created by The Lab, and rooted in its Knowledge Base.
Executives aren’t the only ones who get remedial suggested actions served up automatically; managers do, too. The insights are based on the actual performance of the organization.
(Image)
Each Supply Chain Management dashboard provides an “X-ray” of the business’ performance, per basic KPI metrics such as Days Sales Inventory, Supplier On-Time Delivery, and so on. But there’s more: Each Supply Chain Management KPI is also measured against service level agreement or SLA goals—right down to the individual activity or employee level of detail, with any variations and/or shortfalls clearly indicated. Thus the SLA metric acts as a proxy for customer experience.
Let’s look at an example. In the management dashboard, shown below, depicting Perfect Order Rate or POR , we can view numerous manager insights which the automation serves up for them, well, automatically:
- Correct documentation insight: We can easily see which orders are awaiting proper documentation before proceeding through the process. Which would lead you to ask, “Who is tasked with these specific orders?”
- Root cause insight: Workload. We can now drill down to answer the above question; here we can see that Processor 26 has a workload more than double that of her peers. So now you would ask: “How does this shake out when it comes to specific customers and products?”
- Root cause insight: Products. Answering the previous question uncovers the uncomfortable truth that some orders have been “awaiting correct documentation” at 2x targeted SLA levels.
The insights alone are eye-opening. But the dashboard doesn’t stop there. It serves up remedial actions which should be taken, such as:
- Reviewing the backlog for Processor 26.
- Drilling down to specific orders awaiting proper documentation.
- Re-assigning those orders to other processors.
- Coaching for documentation queue management.
(Image)
Watch it in the real world. See a 4-minute video from The Lab, demonstrating “Wholesale Distribution Executive KPIs: AI + Automated Data Standardization, Reporting & Improvement,” right here.
Build your own KPIs for supply chain managers to use
You can create these management-level KPIs on your own for supply-chain managers; follow these steps:
a. Scrutinize existing supply chain management reports
b. Socialize the design of the dashboard template
c. Get management sign-off on both the design and use-case of the management dashboard
d. Connect the management supply chain dashboard to existing data sources
e. Conduct user-acceptance testing/UAT of the supply chain management dashboard
f. Upgrade the dashboard, using UAT feedback
g. Push out the final supply chain management dashboard for publication
h. Distribute all associated user manuals and documentation
Already Have A Data Warehouse? Good, Here Is What Comes Next
How can I benefit from The Lab’s data model if my supply chain business already has a data warehouse?
Supply-chain businesses are frequently early adopters of data warehousing technology; they’re keen to centralize all of their information in a single data lake.
In many cases, however, that’s where their data initiative stalls. It is certainly important to centralize your data, but you can’t truly reap the benefits of data and KPIs for supply chain unless you also standardize it.
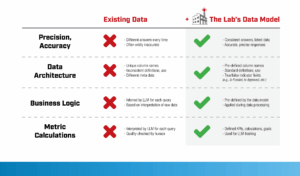
The Lab’s data model distinguishes itself by not requiring a data lake or warehouse already in place, the model standardizes existing data structures—producing data that is not only centralized but also standardized and ready for downstream use.
With that strong foundation in place, the data can support pivots, cuts, derivatives and combinations across analytical and automated workflows. Data is standardized for both human and automated consumption serving analysts and RPA/AI systems equally.
(Image)
The concept is straightforward: standardized, high-quality input data produces more reliable, high-quality output.
How Integration Actually Works
A straightforward process your data analysts can lead.
Simply follow these steps to integrate The Lab’s data model into your supply chain operation:
- Add the standard data table to your supply chain network
- Plan out the schedule and priorities for data mapping
- Build out your supply chain data-loading processes as necessary
- Load in your existing system/warehouse data to the standard tables
- Standardize all of your extant product categories
- Standardize all of your extant supply chain cost-center and departmental categories
- Standardize all of your business’ market/branch/region/warehouse categories
- Promulgate the data model and associated documentation
Do It Yourself—Or Let The Lab Do It Four Times Faster
How to choose the right approach — and why engagement speed matters.
The Lab is, at its core, an implementation firm. Yes, that includes implementing the Standard Data Model for clients who prefer a more managed approach.
If you do plan to do it yourself, look to your data analysts, since they know the business and its KPIs; they’re better suited than, say, your IT team, to refine your data and map it to The Lab’s data model. This will also free up your overworked IT team to focus on core activities, with their help only needed at the final mile of integration and connection.
But there are other reasons to engage The Lab for the integration. Integration timelines are a meaningful differentiator, and The Lab can usually get our data model integrated 4x faster than your analysts could. When you work with The Lab, we’ll handle it all:
- We run the data-mapping project.
- We dig deep to find every source to be mapped to the standard data model.
- We map all of them.
- We employ proven teaching methods to help your internal teams