














Data Standardization: A How-To Guide for Professional Services Firms
Learn how to implement agentic AI, onboard digital automation, and take advantage of Executive KPIs™
· Transform data into competitive advantage
· Increase productivity 2x to 5x
· Keep ahead of pressing trends like pricing squeeze and increased regulation
Your Data is Centralized, but Is It Standardized?
Why centralizing your data is only the first step
As an executive, business-unit or technology leader, or even part of an internal improvement team at a professional services business, you know you are sitting on a ton of data. It does not matter which kind of professional services you offer: It could be accounting and auditing. It could be management consulting, legal services, IT and security, engineering and architecture, PR, HR, you name it.
Your data comes from, and resides within, tons of different platforms that you use, such as:
- Professional services automation (PSA), including platforms like Scoro, Kantata, and Productive.
- ERP (enterprise resource planning) especially for professional services, including systems such as NetSuite, Deltek Vantagepoint, and Microsoft Dynamics 365 Project Operations.
- CRM (customer relationship management) systems such as HubSpot, Salesforce, and Intapp.
- Financial and time-tracking systems like Sage Intacct and QuickBooks Time.
- Document management tools like iManage, Google Workspace, and Microsoft 365.
At this moment, you may well have started to migrate and aggregate that data into a centralized location: a “lake” or “warehouse.” But have you done the work of standardizing it all so it’s automation-ready?
Probably not, which is why you are reading this article from The Lab. To preview what follows, consider what becomes possible once your data has been standardized with that level of rigor:
- You, or anyone you delegate, can “converse” with data, the way you would query any chatbot, but focused on your own business data. No more tasking analysts with running reports, or “deciphering” them for you.
- Automation expands to more tasks, and the benefits compound downstream of each bot.
- You will gain strategic decision-relevant insights triggered and served to you in real time in accordance with your own professional-service KPIs, spanning finance, operations, clients, employees, and more.
Thanks to our Knowledge Base, The Lab has templatized models to help you standardize your professional services data. We also have pre-built KPI dashboards, agentic AI and bot use-cases (and even code), which support rapid knowledge transfer and performance increases of 2x to 5x in professional services.
What Capabilities Does Standardized Data Unlock?
The four capabilities you gain once your data is standardized
Once you standardize your professional services data, you will gain four newfound capabilities:
1. Customer/market advanced analytics for professional services. Detect how the market is moving, including weak signals at the periphery. Give your sales team stronger upsell, cross-sell, and prospecting capabilities.
2. Operational performance across offices and field operations. Depending upon the footprint of your professional services firm, you will gain newfound visibility into external and internal performance. See root causes; get automatically-served solutions.
3. Executive KPIs for professional services. Curated especially for the C-suite, these provide instant information on the health of your professional services firm; each KPI can be drilled into.
4. Management KPIs for professional services. These are essentially the “zoomed-in” versions of the Executive KPIs mentioned above, tailored especially for frontline management and project leads. They support real-time, proactive management decisions.
Do You Need a New Data Warehouse?
Why standardization, not new infrastructure, is the requirement.
You can set that concern aside, along with the budget for it. You will not need a new data lake to gain the four capabilities we have listed above (and will detail below). The Lab’s Standard Data Model works with whatever data warehouse/data lake you already have. And even if you don’t have one, The Lab’s Standard Data Model still works with the data you have.
Want to watch The Lab’s Standard Data Model in action, where it is actually powering AI? Watch this YouTube video from The Lab, which shows you how it works in the industry of banking; you will easily see how this same “actual internal and external business intelligence vs. standard internet ‘knowledge’” applies to professional services firms. We built this AI chat agent using Microsoft Copilot.
Let’s now examine the four capabilities we had listed above.
Customer and Market Analytics
See which clients, services, and prospects drive the most margin
Here’s a scenario relevant to any professional services executive:
Imagine being able to see, at a glance and in real-time, which of your professional services deliver the most profit. Then see which clients are the most profitable. See the best cross-sell and up-sell opportunities. Then see where and how to find prospects that closely resemble your most profitable clients: that is, the ripest possible sales prospects.
Four “Navigators” from The Lab for customer and market analytics
The Lab has created “Navigators” to help you get this information served up to you, automatically, every day.
Watch it in action: In the industry of banking, watch a 4-minute demo video of The Lab’s Product and Customer Profitability and Cross-Sell List Generator; check it out here.
Here are four “navigators” for professional services available from The Lab:
1. Professional Services Profit Navigator.
Imagine being able to know, at a glance, information such as “The top 10% of services are driving upward of 86% of net margin.” This navigator thus…
- Analyzes margin and yield, by each client account
- Categorizes and totals by client, by service provided, and so on
- Assigns actual “A” through “F” profitability grades
2. Professional Services Client Navigator.
Get instant insights like “The top 8% of clients are responsible for upward of 91% of net margin” This professional services navigator:
- Arranges clients by demographic and firmographic
- Segments clients by map/ geography (with visuals)
- Finds cross-sell targets
- Develops sales and marketing contact lists
3. Professional Services Prospect Navigator
Look beyond your current clients; find the highest-value prospects. This navigator…
- Finds client prospects with the appropriate pre-defined demographic and/or firmographic values
- Locates them by geography
- Develops sales and marketing contact lists
4. Professional Services Upsell/Cross-Sell Navigator
This “navigator” from The Lab lets your professional service firm see which specific add-on services are most appropriate to existing clients, or prospects, which the other navigators have identified. This navigator…
- Delivers market-share data and growth trends
- Highlights major competitive opportunities
Operational Performance Across Offices and Field Operations
Compare performance across every location from one source of data
When it comes to professional services branch offices, field operations, and client on-site work, you will often get conflicting feedback. One office manager may cite specific reasons for specific staffing. Yet another office manager, often in a different part of, say, the same metro area, will have wholly different views on the subject.
This is not a matter of opinion. It is a data question. You want to optimize the performance of every single site, from a single source of data-driven truth.
The following four professional services analytics dashboards from The Lab provide this kind of needed clarity.
See it on video. In the industry of banking, watch this 3.5 minute Retail Branch Network Staffing Model/Cost Reduction video from The Lab.
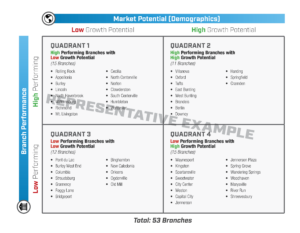
- Professional Services Branch Office/Field Operations/On-Site Comparison Analytics. Compare different locations by performance and market demographics and firmographics.
- Professional Services Branch Office/Field Operations/On-Site Scorecard Analytics. This dashboard delivers letter grades of the low- and high-performing locations. It also highlights the best markets for expanding your professional services footprint.
- Professional Services Branch Office/Field Operations/On-Site Staffing Model. Similar to that shown in the banking video above, this AI and advanced analytics for professional services firms serves up the ideal recommended staffing for each location, with adjustments available for historical and projected growth.
- Operational hours analytics dashboard. This tool aggregates actual activity data from each branch office/field operations/on-site team, at daily and even hourly intervals, to highlight opportunities or recommend improved hours of operation.
Executive KPIs for Professional Services
How to choose the vital few KPIs the C-Suite need
What are the “vital few” KPIs for professional services executives?
There are plenty of KPIs that span professional services performance; we will talk about more of them in the following “Management KPIs” section. But for leaders in the C-suite, you need the “vital few” required to manage, monitor, and improve your business. This is why The Lab offers a handbook of Executive KPIs for Professional Services, which you can download here.
The KPIs in this handbook are organized across the goals of growing revenue, preserving margin in the form of billable hours, and increasing efficiency via improved productivity. Each KPI has its own definition and formula, so it is easy to use from any source data.
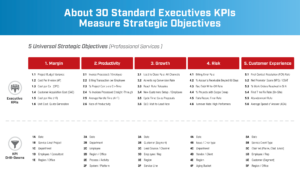
The professional-services dashboards built from these KPIs (and of course, available via templates from The Lab) are not static. They are dynamic. The top two levels are automated, with pre-determined triggers based on KPIs and/or business rules that you designate. When a threshold is met, recommended actions are served up automatically; the automation will:
1. Identify variance:
- Employees
- Clients
- Services
- Locations
2. Pinpoint causes
- Variable follow-up
- Improperly priced contracts
- Poor-quality prospects
- Delays and/or failures among processes
3. Prevent on going issues
- Automated follow-up
- Standardized pricing
- Rules for prospect prioritizing
- Less document-input error
Each automation is linked to best-practice improvements, which executives can share with management. This keeps the C-suite focused on strategy and resolution, with operational execution appropriately delegated.
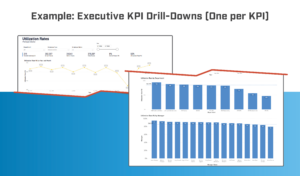
Check out this three-minute video from The Lab, in which an anonymized professional services firm was able to reduce DSO (days sales outstanding) and speed collections using standardized, automated data intelligence.
The best practice checklist for building professional services Executive KPIs
- Review extant executive-level reporting
- Establish top-level executive scorecard
- Develop portal design for professional services Executive KPIs
- Populate with initial data
- Publish first pass Executive KPIs for user acceptance testing in the C-suite
- Use UAT input to develop/iterate
- Populate the remaining professional services Executive KPIs
- Push out/publish documentation
Management KPIs for Professional Services
The zoomed-in KPIs that frontline managers act on daily
How do you construct these KPIs for managers?
The Lab has created a curated catalog of more than 250 standard KPIs to manage strategy and operations in professional services. It’s an ideal starting place for finding management-level KPIs; they are categorized by:
- Cost
- Productivity
- Revenue
- Organization
- Quality
- Service
- Volume
Just like the Executive KPIs we had described above, the templatized analytics dashboards from these KPIs (there are dozens pre-built) feature embedded automations which provide insights into performance and corrective measures, too.
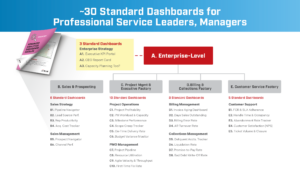
Each dashboard accomplishes two goals:
- It reveals performance in real time, such as cycle times for invoicing and collections.
- It shows how those KPIs, at the employee and work-product levels, stack up vs. set SLA (service-level agreement) targets. It’s thus a proxy for client experience, too.
Underperformance or variance is called out in each dashboard.
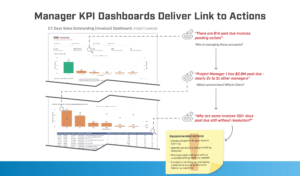
For example, in the image below of a Days Sales Outstanding management dashboard, we can see different insights which managers are served via the “bot”:
- First Professional Services Insight: In this example, over 600 different past-due invoices are “underway” for processing, but stalled and not generating revenue. The associated insight is: “Who are these assigned to? “
- Second Professional Services Insight: By answering “Who are these assigned to?“, we see that Project Manager 1 is struggling under 2x to 3x the invoices as others. Next question: “How does that shake out among different clients?”
- Third Professional Services Insight: Answering “How does that shake out among different clients?” reveals that some past-due invoices have sat untouched for ten to seventeen weeks. We can see that some past-due invoices still listed as “Started” have been sitting for three to four months.
The analytics “bot” then automatically delivers recommended actions, such as:
- Reviewing Project Manager 1’s backlog.
- Finding stalled “underway” past-due invoices.
- Re-assigning invoices/accounts to different Project Managers as necessary.
- Conducting queue-management coaching
See it in action: Watch Professional Services automation at work in this video from The Lab. It even includes the “My Billing and Collections” dashboard, which helps project managers and managing directors to keep track of past-due invoices by age, client, and invoice number.
How to build Professional Services Management KPIs
- Start with extant professional services management reports
- Design the dashboard/how it looks
- Get use-case sign-off/approval
- “Wire” the dashboard to actual data sources
- Publish the prototype dashboard
- Conduct user-acceptance testing with managers
- Iterate per UAT feedback
- Finalize, publish dashboard
- Push out user guides
Why Use The Lab’s Data Model if You Already Have a Warehouse?
Centralizing your data is not the same as standardizing it
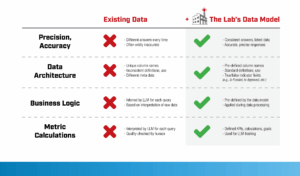
Your professional services firm may already have a data lake or data warehouse. That’s a prerequisite for centralizing your information. But it does not mean that that data has been standardized for AI, automation, or centralized KPI reporting. Too many professional service businesses stop at the “centralizing” phase, and pay a significant opportunity cost.
To realize the strategic vision of data-driven performance in professional services, it’s best to take advantage of The Lab’s data model. It works with your existing warehouse or lake; it standardizes all of that housed data so it is actionable and ready to deliver the capabilities we have outlined above.
The Lab’s data model makes your information easy to use and manipulate, across pivots, cuts, derivatives, and various combinations. Once it’s unified into a single source of truth, it’s easier for both people and digital workers to use it.
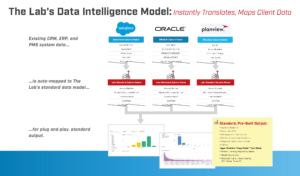
Good input data, of course, yields good output.
How Do You Integrate the Data Model, and Who Should Run It?
The sequence to follow, the people to assign, and when to lean on The Lab
Follow this process in order:
- Establish tables for standard data on your network
- Create the plan/schedule/priorities for mapping data in your professional services business
- As needed, create the data-loading processes
- Load in the data from your systems/lake/warehouse directly to The Lab’s standard tables
- Now you can standardize all service categories
- You can also standardize all department, business-unit, and cost-center categories
- Next, standardize all branch office/field operations/on-site categories
- Hand off the data model and documentation to the appropriate stakeholders
The Lab has templatized the process. Map your data sources to the templates, and the integration is largely complete.
The best people at your professional services firm to handle this assignment are existing data analysts, who understand both the business and its KPIs.
Your IT shop is not your best first choice. They do not have either of those skills that your business analysts do, and it’s safe to say that their plates are already full with daily IT work. Use them, instead, for the “final mile,” ensuring that everything is connected as it should be.
What if your business analysts are strapped for time? In that case, engage The Lab. Our data scientists can do this work for you, and given that this is their daily job, they will be faster, up to 4x faster, than anyone on your team.
Armed with the knowledge to refine, categorize, define, and map your data to the model, we can dig into each source, mapping them all while running the project. We even teach your team “the ropes,” based on best-practice implementation we have honed across literally thousands of client engagements.
What ROI Can You Expect?
The performance, margin, and capacity numbers to plan around
Reduce costs via Executive and Manager KPIs. Increase revenue and margin via client and market analytics tools.
Typical benefits are substantial:
- Increase performance by 2x or greater
- Earn two to five more margin points on new engagements
- Align capacity to demand in branch office/field operations/on-site team network
There is a further benefit. By eliminating the need to delegate reporting, along with its cost, turnaround time, and questionable reliability and readability of the resulting reports, you will gain a two- to four-fold return on your professional-services data-standards investment.
And what kind of price, or ROI, can you put on the confidence of having a single source of truth you can query at any time? Many leaders consider that value hard to overstate.
Standardize Your Professional Services Data with Help from The Lab From first conversation to full transformation in 6 to 12 months
At this point, you are likely ready to put your professional services data to work, and increase revenue and margin while reducing costs, and enabling agentic AI, automation, and data-intelligence-driven KPIs.
The Lab has been helping professional services firms like yours for more than three decades. Let us help you, too. We specialize in working with executives, business-unit and technology leads, and internal improvement teams to achieve meaningful strategic enterprise transformations, with quantifiable results.
Our Knowledge Base, packed with 30-plus years of templatized, best-practice client-engagement IP, paired with our patented Knowledge Work Transformation™ delivery methodology, can transform your professional services organization in just 6 -12 months.
If you are ready transform your data, and your professional-services business, book your screen-sharing demo with our experts, all based at our Houston headquarters. Simply call (201) 526-1200 or email info@thelabconsulting.com today.