Standardize the Data of Your Global Operations’ Payments Function
“Talk with your data” via agentic AI, Executive KPI™s, advanced analytics, and automation to improve performance 2x – 5x
• Increase operational efficiency
• Improve security; reduce fraud
• Increase authorization rates and other KPIs
“Talk with your data” via agentic AI, Executive KPI™s, advanced analytics, and automation to improve performance 2x – 5x
Standardize the Data of Your Global Operations’ Payments Function
Payments are the lifeblood of your enterprise—and the stock-in-trade of its global payments function. You already have mountains of data—from your core system to payment gateways to card networks to the general ledger (GL) and more. But your strategic challenge—whether as a C-suite executive, part of an internal improvement team, or technology lead—is to transform that data into enterprise value lift.
Your data from all your different systems may already be centralized in a common data warehouse or “lake.” But whether it is or isn’t, it must first be standardized for AI and automation; those are table-stakes for the benefit-rich advantages of data standardization in your payments function. These include:
- You’ll get instant insights that you can act upon, creating actual cashflow benefits—driven by your own data.
- Anybody inside your global-payments function (or other shared services, as you designate) can “converse” with this standardized data. They can ask questions in English, and get clear answers, in English, just like that. No more “report gurus” fielding ad-hoc requests and laboring to analyze and explain their findings.
- Your shared-services robotic process automations or RPA/“digital workers” will be empowered to perform more, and more complex, tasks.
These benefits accrue to all phases of payment processing, including initiation, encryption/transmission, authorization request, authorization/decline, response relay, clearing, and settlement, depending upon which areas your shared-services function focuses.
The Lab makes data standardization—and thus empowerment—easy. Our Knowledge Base features semantically-structured data harvested from more than three decades’ worth of actual client-engagement IP with leaders across numerous industries. Our automated data model normalizes data differences between all common systems, which quickly readies your shared-services payments data for AI, automation, and analytics.
The Lab’s Knowledge Base features pre-fabricated data-standardization models, agentic AI, advanced-analytics/data-intelligence dashboards, and industry-specific Executive KPIs (key performance indicators) which help C-suite leaders like you to drive performance improvements ranging anywhere from 2x to 5x.
Four capabilities that transform your payments data
What newfound capabilities can your payments function get from standardized data, predictive analytics & KPI dashboards?
There are four chief capabilities which your payments-processing function will gain when its data is standardized and normalized for AI and automation in global payments and other shared services:
- Advanced customer analytics. With standardized data, you’ll gain newfound insights about your customers, enabling you to detect behaviors and trends, and increase margin at every touchpoint. You’ll also improve your capabilities in value-added activities such as digital identity, risk solutions, charge-back mitigation, and KYC (know your customer) analytics.
- Newfound retail analytics. Gain more visibility into your retail network performance in near- or real-time. You’ll even be served up with identified root causes and solutions for specific issues.
- Payments Executive KPIs. These “vital few” KPIs provide an instant view of the overall health of your global-payments function. And since each Executive KPI is expandable, you’ll gain even deeper insights into causes and solutions.
- Payments Manager KPIs. Whoever said that only executives should have KPIs at their disposal? Not The Lab. Manager KPIs are operationally-focused, and feature automated insights served up to frontline leaders, helping them gauge performance more effectively, and make better decisions in response.
This long-form “explainer” from The Lab will detail each of these capabilities. We’ll offer real-world examples, too—enabled by our Knowledge Base and Standard Data Model.
No rip-and-replace required
Will you need a new data warehouse to implement agentic AI and advanced analytics in global payments operations?
Many global payments executives are rightly concerned that their existing tech stack is insufficient for these new data challenges, and thus would require a costly rip-and-replace of their data warehouse or data lake.
Fortunately, such drastic measures are neither needed nor advised. As noted earlier, The Lab’s Standard Data Model can normalize whatever data you already have. In fact, if your enterprise payments function doesn’t have a data warehouse—let’s say your data is still spread out across all your disparate systems—then The Lab’s Standard Data Model will be the only thing you’ll need.
Want to see how The Lab’s Knowledge Base works? Look no further than this four-minute YouTube video. You’ll see how all of its elements—data analytics models, best practices, automation code, and more—have been semantically structured and templatized for rapid rollout to your shared-services functions.
Let’s take a closer look at the data-driven capabilities we’d enumerated above:
Global payments capabilities from data standardization
1. Advanced customer analytics
At this point, we’d like to discuss what are called “Navigators” for global payments processing functions. These are essential for creating automated insights which reveal, in real time, things like:
- Which products deliver the most enterprise profit
- Which customers or clients deliver the most enterprise profit
- Where to find those people and businesses
- How, specifically, to up-sell/cross-sell to these accounts
- And more
The top 4 navigators for automating insights to increase sales growth, improved margin, and market expansion
Customer, Profit, Prospect & Market Share Navigators Explained
The following 4 “navigators” from The Lab provide this information—served up automatically—every day. So there’s no need to wait for the usual “every few years of strategic updates” cadence.
Watch it in action: In the industry of Banking, witness The Lab’s Product & Customer Profitability and Cross-Sell List Generator in real-world use. Simply view this quick video.
1. The Customer Navigator.
Uncover actionable insights along the lines of “Our top 12% of customers are delivering over 91% of net margin.” This navigator:
- Segments customers by demographics, firmographics, and even geography (with visual map overlays)
- Identifies cross-sell targets
- Creates sales- and marketing-ready contact lists
2. The Profit Navigator.
This automated navigator delivers insights like “The top 12% of products create over 86% of net margin.” With this navigator, you’ll see how it automatically:
- Aggregates data by customer, by product, by service, etc.
- Auto-calculates margin and yield, by account
- Assigns actual “A” through “F” letter grades for profitability
3. The Prospect Navigator.
To reach beyond your current customer base, use this navigator from The Lab, which:
- IDs prospects who match your preferred demographic, firmographic, and geographic conditions
- Generates sales- and marketing-ready contact lists
4. The Market Share Performance Navigator.
This “navigator” identifies which products or services to up-sell or cross-sell to the customers, clients, or prospects which the previous navigators have identified. The Market Share Performance navigator:
- Delivers current market-share data and growth
- Identifies your top competitive opportunities
Global payments capabilities from data standardization
2. Newfound retail analytics
It’s no secret that your retail network landscape is hardly homogenous:
- A manager in Center City Philadelphia will want to staff his location in a certain way.
- Yet a manager just a few blocks away near the Penn campus will harbor totally different views on staffing.
Which begs the question: Who’s right? Or more pointedly: What does the data tell you?
Wouldn’t it be great if you had indisputable data to optimize the performance of every single branch location—and your entire retail network?
Here are four analytics from The Lab to help you accomplish just that.
5. Retail Branch Staffing Model Analytics. As you can see (for the industry of Banking) in the video below, this agentic AI/advanced analytics tool delivers optimum staffing levels for each branch in your retail network. You can easily adjust it, too, factoring in historical and projected growth.
Watch it in action. For the industry of Banking, watch a demo of our Retail Branch Network Staffing Model/Cost Reduction analytics; see it in this brief video.
6. Retail Branch Comparison. Compare different branches instantly; see how performance and market demographics contrast between locations.
7. Branch Scorecard. Get letter-graded and color-coded rankings of high-performing branches—and the under-performing ones, too. Quickly reveal the top-potential markets for expanding or entering.
8. Operational Hours. This tool collects, collates, and aggregates actual retail branch transaction data—both daily & hourly—to reveal opportunities and/or suggest better hours of operation.
Global payments capabilities from data standardization
3. Payments Executive KPIs
Identify the C-suite metrics which inform global payments performance
The Lab has identified literally hundreds of key performance indicators or KPIs which pertain to global shared services such as payments; you can find catalogs of our different KPIs for various industries, as well as handbooks for business processes and more, on our Resources page. Each KPI includes its definition and formula.
The Lab has further refined these hundreds down to the “vital few” KPIs needed for executive management of global payments, such as:
- Cost per Transaction
- Payment Conversion Rate
- Authorization Rate
- Decline Rate
- Chargeback Ratio
- Payment Decline Recovery Rate
- System Uptime SLA
To help with timely and proactive management, top-level actionable insights are served up automatically. If any Executive KPI falls off below its target for a certain time period, recommended actions are distributed to leadership…
9. Identifying the underlying root causes
a. Authorization failures at specific card networks or merchant categories
b. Settlement delays or reconciliation discrepancies
c. Elevated chargeback ratios from specific channels or processors
d. System latency or downtime affecting transaction throughput
10. Pinpointing the source(s) of the variance
e. Processor or gateway
f. Payment method or card type
g. Transaction volume or time-of-day patterns
h. Geographic region or merchant category
11. Preempting future failures
i. Trigger automated retry logic for declined transactions
j. Flag processors with declining authorization rates for review
k. Establish chargeback thresholds with auto-escalation rules
l. Streamline dispute documentation to reduce resolution cycle time
Thanks to The Lab’s Knowledge Base, each Executive KPI automation is linked to best-practice improvements which leaders can use with front-line management. This way, executives can concentrate on the progress of resolution, with inarguable data backing them up.
Building your payments performance scorecard
How do you construct an Executive KPI for global payments?
Follow this eight-step process:
12. Review extant exec-level reports
13. Establish top-layer executive scorecard
14. Design Executive KPI portal
15. Add data for initial KPIs
16. Roll out v1 for executive user acceptance testing
17. Fold in feedback from user acceptance testing
18. Add remaining Executive KPIs
19. Hand off user guides/documentation
Global payments capabilities from data standardization
4. Payments Manager KPIs
How do you create the relevant global payments KPIs for managers?
As with Executive KPIs, The Lab has assembled about two dozen standard KPI dashboards for the different shared services within a given industry enterprise. Each dashboard features about a half dozen KPIs for gauging quality, productivity, service, and costs.
Manager KPIs for global payments processing are similar to Executive KPIs for global payments processing; the analytics have baked-in automations to serve up actionable insights, triggered by the KPIs themselves.
Each of the multiple Manager KPIs dashboards serves two functions:
20. They give deep insights into the business function’s performance, such as invoice processing time at different activity cycles and stage gates.
21. They show how those KPIs—even at the individual-employee level—stack up against SLA, or Service Level Agreement, goals such as System Uptime. All of these ultimately affect the ability to provide a seamless customer experience.
Any drop-offs or inconsistency is visually depicted in each analytic dashboard.
For example, in the image below of a management dashboard detailing Settlement activities, we can see three different insights served up by the automation for managers:
- First insight: As shown below, 1,026 deposits have been transferred by the acquiring bank into the merchant account, yet 1,569 are due, according to data from other systems. This poses the automatically-served question: “Why don’t these reconcile?”
- Second insight: By answering “Why don’t these reconcile?”, we can see that Processor 12 is handling 6x more recons than her peers. And so a new question is surfaced, and automatically served up to management: “How does this stack up across different products, services, and internal customers which this shared-services function serves?”
- Third insight: When we dive deep to answer the previous question, we can see that some product lines are still “Awaiting Settlement” after six to eight weeks.
The automation then provides management with recommended actions to take, which include:
- Reviewing the backlog for Processor 12.
- Identifying any other product lines which may be suffering settlement delays.
- Re-assigning settlement recons to other processors as needed.
- Conducting recon-queue-management coaching.
A step-by-step build guide for payments managers
How do I construct Manager KPIs for global payments in shared services?
Follow these best-practice steps to create the Manager KPIs you’ll need:
- Scrutinize extant payment-processing management reports
- Design the concept dashboard template
- Get buy-in/sign-off on use-case design
- Connect the new payment-processing management dashboard to source data
- Publish the payment-processing management dashboard
- Launch user-acceptance testing or UAT for managers
- Fold in feedback from UAT
- Update dashboard to “Final”
- Publish all appropriate user guides and documentation
Already have a data warehouse? Here’s why you still need this
If your payment-processing function has a data warehouse, why would you want to use The Lab’s data model?
Shared-services payment processors typically have a head-start when it comes to centralizing all of their transactional data. But centralizing and standardizing are two different things; you can’t gain all the benefits of data-driven performance we’ve been describing in this article without the latter.
Regardless of the size or sophistication of your data warehouse/data lake, The Lab’s data model can help you. It interfaces directly with your existing data warehouse and sources, normalizing it all as a single trusted repository.
Once your global payments data has been standardized by The Lab’s data model, you can slice-and-dice it as needed: pivots, cuts, derivatives, and combinations. And since the data is defined both for people and RPA bots, they can each work with the data more easily.
Good input data also results in good output data.
Your integration roadmap, step by step
How should global operations integrate The Lab’s data model into the global payments function?
Follow this step-by-step best-practice sequence:
- Install the standard data tables from The Lab on your network
- Prioritize the data-mapping schedule
- Build all required data-load processes
- Load the different sources of global payments data—from the different systems and/or your existing data warehouse—to the standard data tables
- Standardize all product and service categories
- Standardize all existing departmental and cost-center categories
- Standardize all market and branch categories
- Publish the data model and its associated documentation
![]()
Measuring the ROI of data standardization
What kind of performance lift can global payments achieve by standardizing its data?
Global shared services will realize cost-reduction and revenue-lift benefits from implementing the data-standardization-enabled capabilities we have detailed in this article. The Manager and Executive KPIs will help to drive cost reduction, while the customer analytics tools will improve revenue and margin.
Global payments leaders who standardize their data as part of an enterprise-wide strategic transformation usually reap benefits such as:
- An additional two to five margin points on new sales
- 2x or more performance improvement
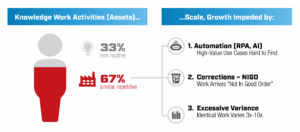
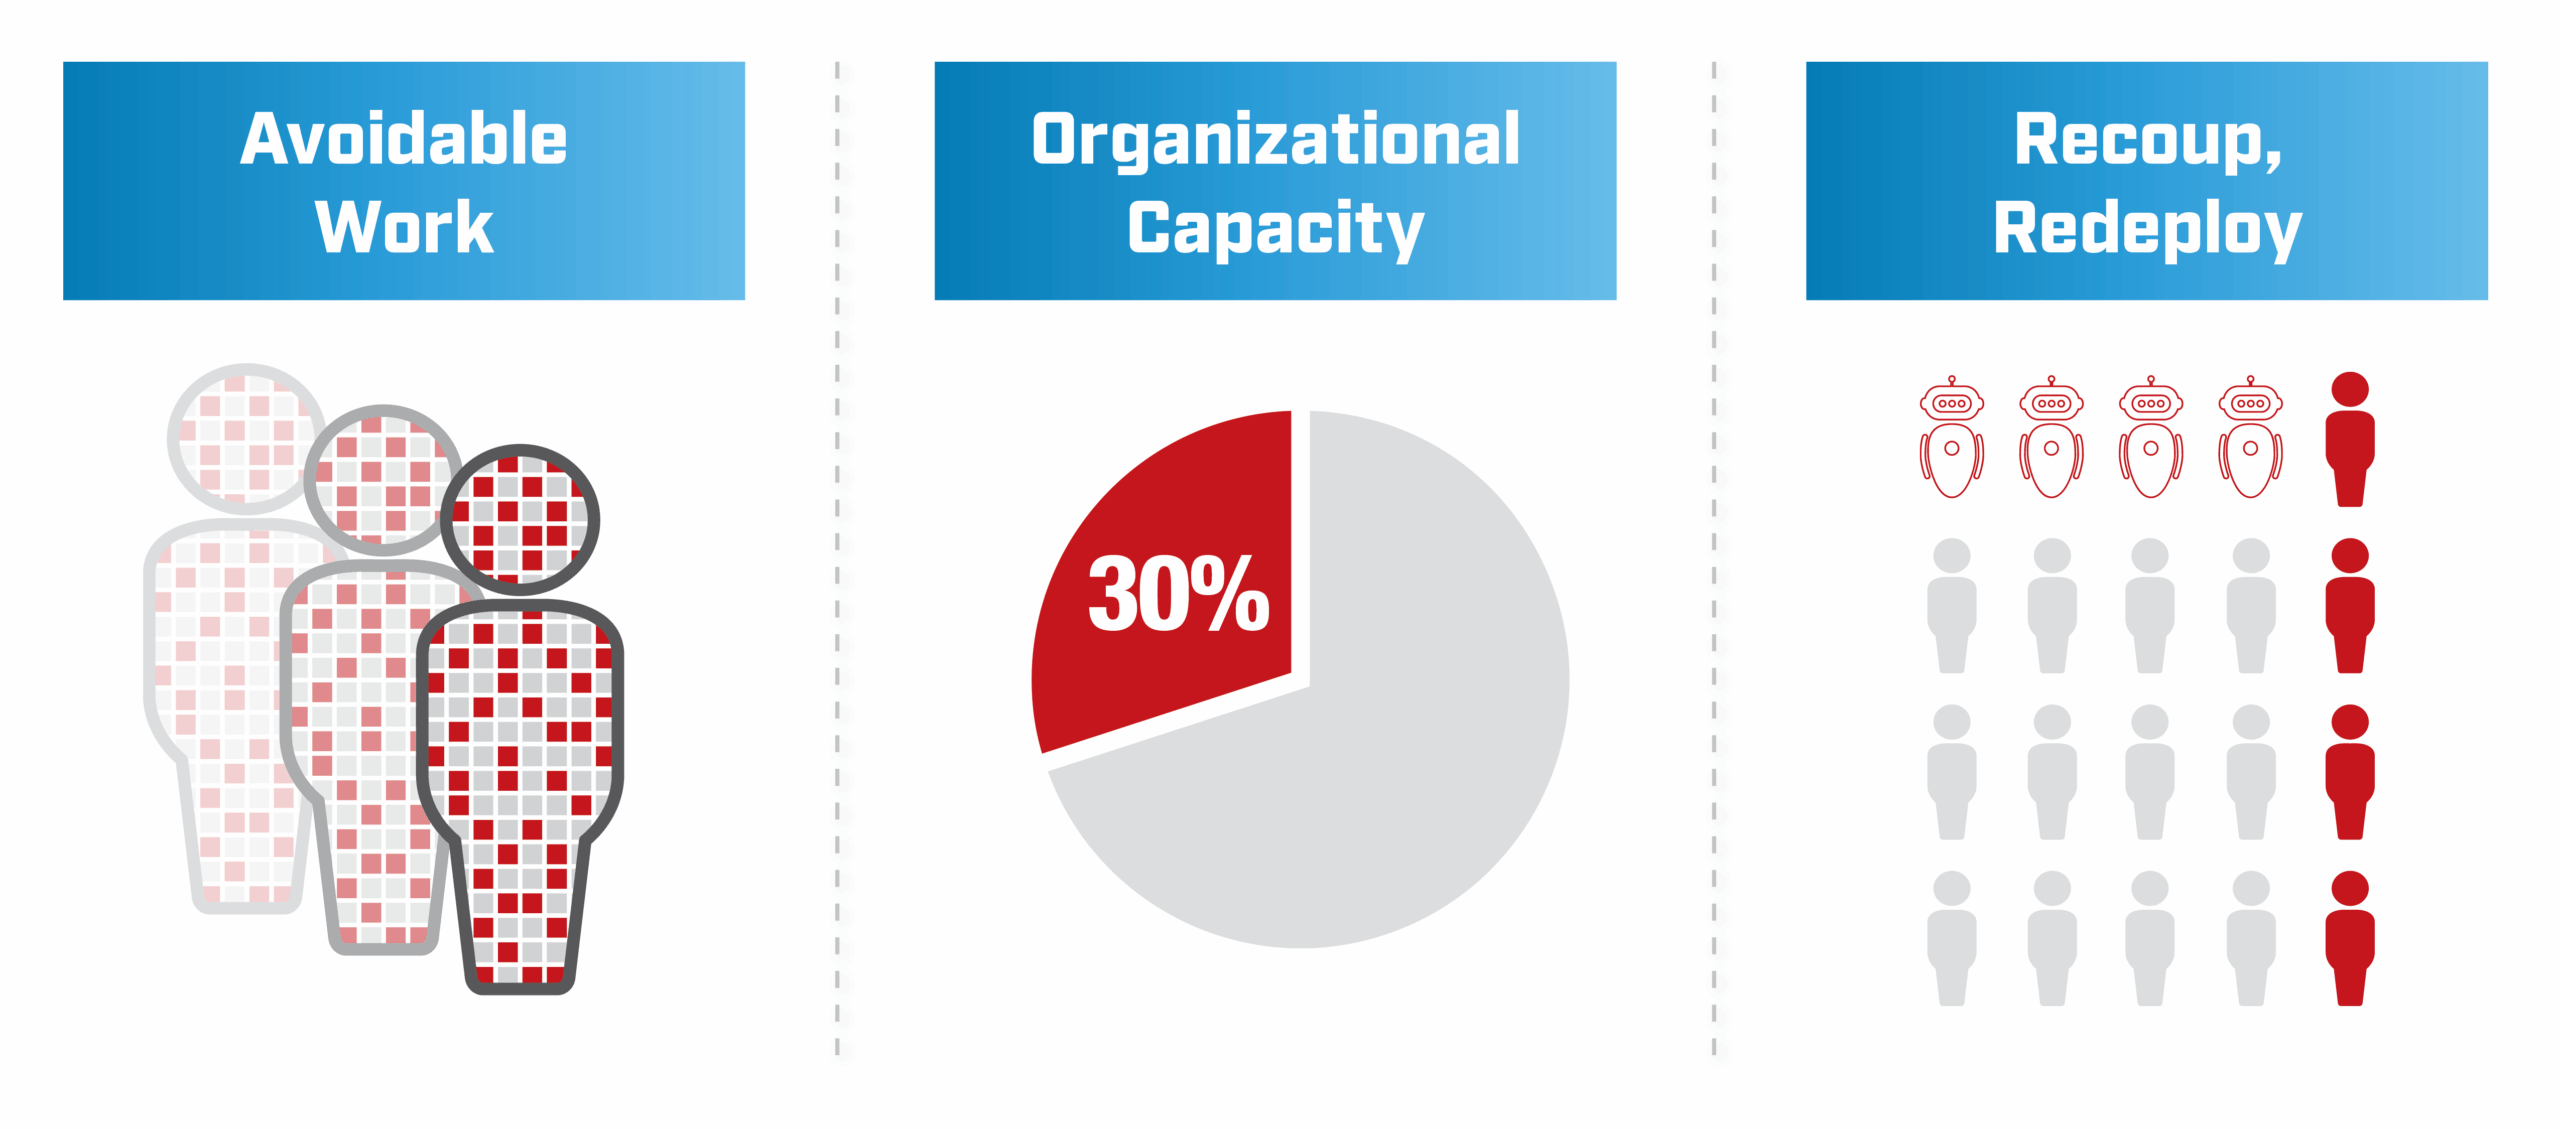
- Capacity rightsizing of 20%–35% across the payments branch network, achieved through eliminating redundant processes and aligning staffing to actual transaction volumes
Beyond the numbers: the qualitative gains
What are the “soft” benefits of data standardization in global shared services & payments?
As a payments person, you live and die by numbers. But there are also benefits from data standardization in global payments that are hard to quantify, but certainly invaluable. Imagine the ability to get the performance data you require, instantly, without the need to delegate the creation of an ad-hoc report. What kind of value would you ascribe to having inarguable data, eliminating all of the back-and-forth arguing and defense of all those ad-hoc reports?
Simply getting your questions answered, instantly and accurately, confers a 2x–4x ROI on data standardization. And what about the ability to have indisputable data at your fingertips? Many global payments leaders would call that downright priceless.
Identifying your internal data champions
Who in my global payments function should integrate The Lab’s data model?
The Lab’s templates are effectively plug-and-play: Just map them to your sources, and you’re off to the data-standardization races.
The best people in your global payments function who should be integrating these templates are your existing data analysts. They understand the business, its data, and its KPIs. They’re thus well-placed to refine and define the data, and map it to The Lab’s data-model templates.
We don’t recommend that your IT people be your first choice for this task. Their plates are already full keeping the IT lights on. Plus they lack the business-analysis skills of your data analysts. Hold off on your IT team; just use them for the final mile, to ensure that all of the connections are properly wired.
Doing more with less
How can my global payments function integrate The Lab’s data model with limited resources?
We mentioned “your existing data analysts” above. But you might not have any—or any to spare. Not to worry. The Lab has North America’s best data scientists in-house (we never outsource or offshore), with process and business experience to map the data even faster than your best analysts could.
The Lab can provide as much help as you need, running the project, tracking down every data source, and mapping it. We even teach your internal teams, using proven best practices.
Your next step toward payments transformation
How can I engage The Lab to standardize all of my global payments data?
The Lab has been helping internal functions like yours for more than 30 years. We’ve worked with execs, business-unit leads, technology leads, and internal improvement teams alike. We’ve helped them to transform their processes—and their enterprise functions—to deliver successful large-scale transformations.
Our unique Knowledge Base of templatized IP, and our patented Knowledge Work Transformation™ delivery approach can transform your global payments shared-service function in under a year.
Ready to transform your data, and your operating leverage? Schedule your demo with The Lab’s friendly Houston-based experts. Simply call (201) 526-1200 or email info@thelabconsulting.com.