How to Standardize Your Bank or Credit Union’s Data for AI, Advanced Analytics, Executive KPIs™, and Automation
Discover how to “chat with your data” to gain newfound competitive advantage via bank & credit union data intelligence:
• Performance lift: 2x or more
• 2 – 5 additional margin points on new sales
• Capacity alignment and reduction of 20%- 35% in branch network
Your bank or credit union has tons of data. That’s a given. But you—as a C-suite executive, technology lead, or internal-improvement team member—may be just now starting to aggregate all of that data, from all of your systems, into a centralized data warehouse or “data lake.” Perhaps you’ve had one for a while. Regardless, the odds are that your data isn’t standardized enough for AI and automation.
But when your bank or credit union’s data is standardized for automation, you gain numerous advantages:
• Anyone within the organization can “chat” with the data, and get instant insights.
• Your bank or credit union’s automations, a.k.a. “digital workers,” can perform even more tasks.
• You’ll get actionable insights, empowering genuine cash benefits—all driven by your own data.
At The Lab, we’ve pre-fabricated data-standardization models, advanced analytics dashboards, agentic AI, and industry-specific Executive KPIs (key performance indicators) which help C-suite leaders like you to drive performance improvements ranging from 2x to 5x.
Best Practice Analytics Capabilities
What are the 4 capabilities that banks and credit unions gain from data intelligence, data analytics, and Executive KPIs?
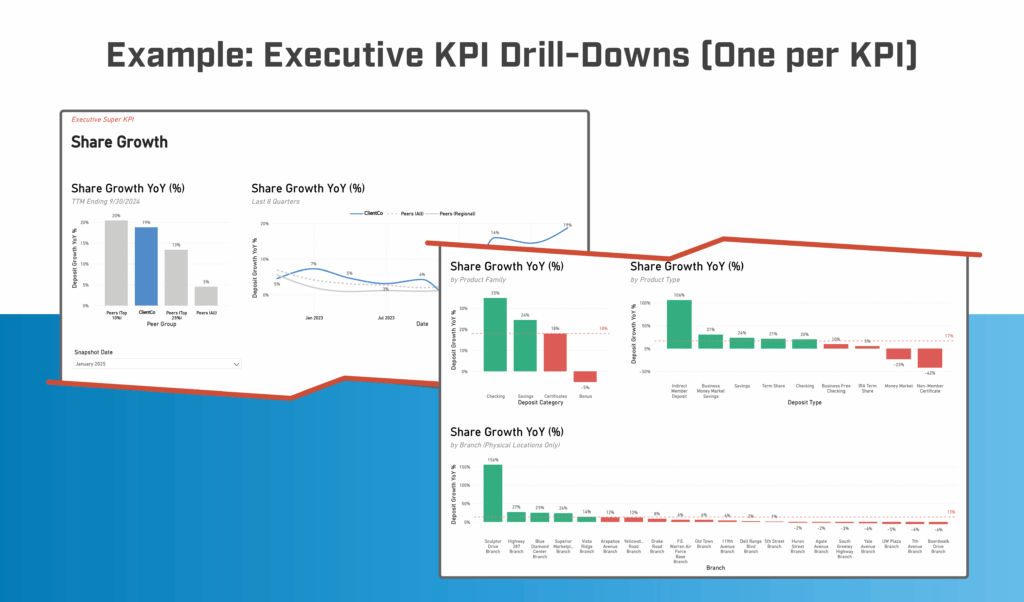
Executive KPIs
These are the “vital few” KPIs which give you an instant snapshot of your bank or credit union’s overall health. (They do more, too, since each KPI is clickable and “dive-able.” More on that later.)
Manager KPIs
This is the next-level drill-down from the Executive KPIs mentioned above. These are the operational KPIs and automated actionable insights which are essential for daily management; team leaders use these Manager KPIs to understand performance both broadly and deeply and make informed decisions accordingly.
Customer and Market Analytics
Imagine having a complete and detailed breakdown of customer and market trends and behaviors to maximize your bank or credit union’s margin at every stage of every business process. That’s what this data-driven capability delivers.
Retail Network Analytics
These are detailed insights into your retail network’s internal and external performance, replete with root causes and even solutions to optimize the network, all baked in.
In this long-form article from The Lab Consulting, we’ll dive into each of these capabilities, providing real-world examples and demos, all made possible by The Lab’s Standard Data Model.
This might have you asking—or indeed worrying—“Will I need an all-new data warehouse or data lake to gain these capabilities?”
Short answer: Nope. The Lab’s Standard Data Model works directly with what you already have; no rip-and-replace required. And if your bank or credit union doesn’t have a “lake” or “warehouse,” then the Standard Data Model is all you need.
Now let’s dive into the four data-driven capabilities we’d mentioned at the top of this article.
Data-Driven Bank/Credit Union Capability 1: Executive KPIs
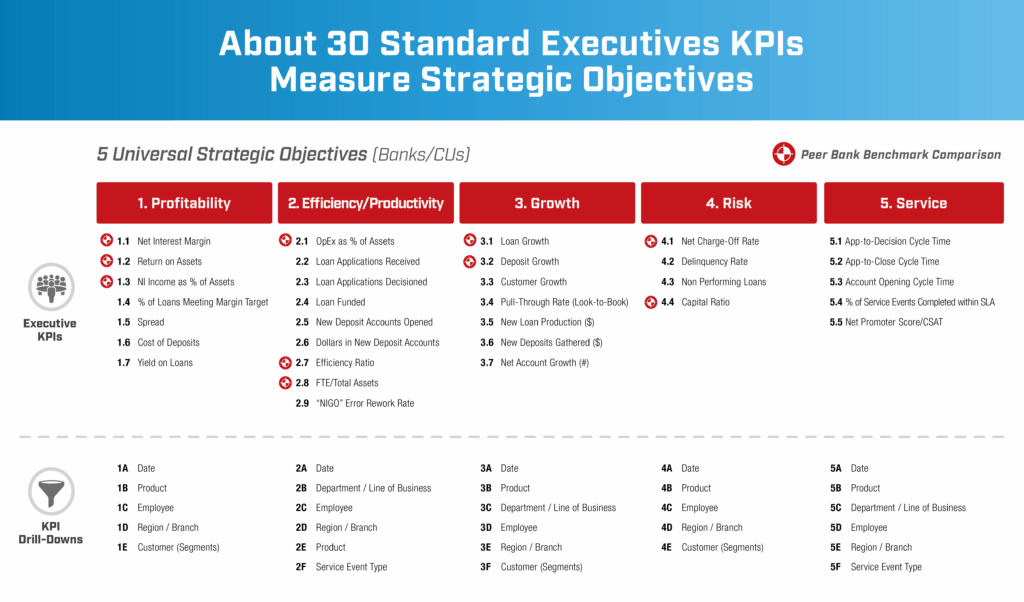
What are the top 30 KPIs to drive strategic decisions in banks and credit unions?
The Lab’s popular KPI Handbook for Banks and Credit Unions includes more than 800 500 key performance indicators or KPIs, along with a definition and/or formula for each metric. They’re also conveniently categorized, to help business managers to understand and use them effectively.
Among those 800, The Lab has identified the top 30 strategic Executive KPIs—and built tools and dashboards around them to drive actionable insights. Each of these 30 KPIs is defined, and its formula documented, so anyone can create it from any source data.
To ensure that management gets highlights and in-depth performance assessments at their fingertips (and at the right time), actionable insights from the top two levels of these dashboards are fully automated. Say, for example, that one of the monitored metrics falls below target for a certain period of time. At that trigger, three recommended actions are automatically defined and distributed to management. The automation will:
- Pinpoint the source(s) of the variance
a. Employee
b. Customers
c. Products
d. Branches - Identify root causes
a. Inconsistent follow-ups
b. Mis-priced deals
c. Low-quality prospect
d. Process failures, delays - Preempt future failures
a. Automate follow-ups
b. Update pricing standards
c. Define prospect prioritization rules
d. Reduce document-collection “friction”
What’s more, each automation within the Executive KPI dashboards links to standard best-practice improvements and actions for the leadership to employ with their front-line management. This allows the leadership to focus on resolution progress, rather than spending valuable time arguing with front-line management whether or not the data is accurate, and why.
Want to watch a 3.5-minute video of this power in action? Check out The Lab’s video showing Bank & Credit Union Advanced Analytics: Executive KPIs Scorecard.
A step-by-step approach to building an Executive KPI
- Access, review existing executive-level reports
- Set up executive scorecard (top-layer)
- Review Executive KPIs portal structure/design
- Populate first-pass data for selected KPIs
- Publish first pass for executive UAT (user acceptance testing)
- Incorporate input from UAT period
- Populate remaining Executive KPIs (including drill-downs)
- Complete and hand-off user guides and documentation
Data-Driven Bank/Credit Union Capability 2: Manager KPIs
What are the vital KPIs for managers, and how do you build them?
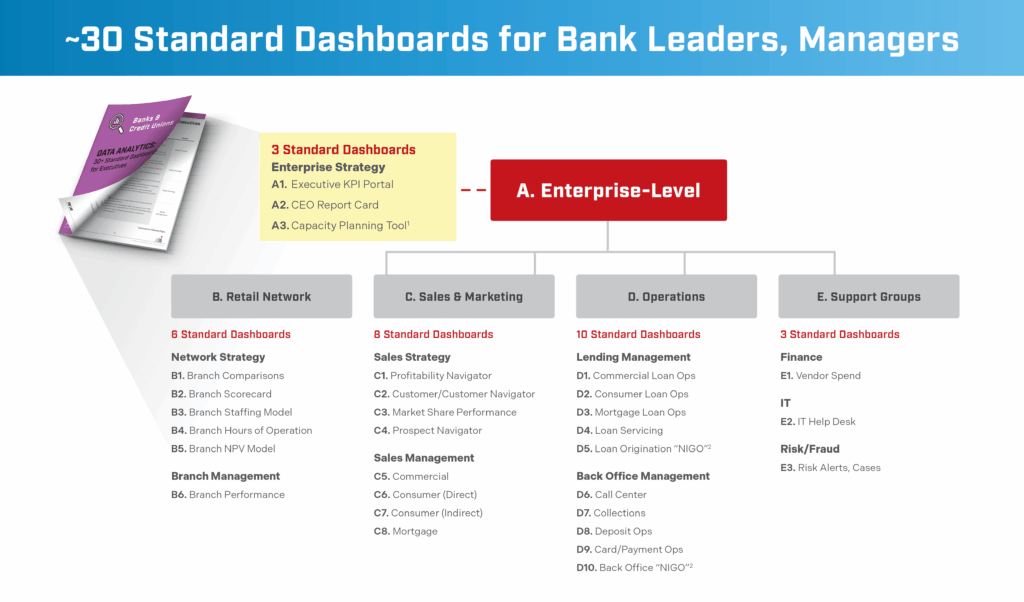
Similar to its approach for Executive KPIs, The Lab has curated 30 standard yet unique KPI dashboards for each main business within a bank or credit union. Each advanced analytics dashboard includes five to eight vital KPIs for monitoring productivity, quality, service, and costs.
Just as with the Executive KPIs, each Manager KPIs analytics features built-in automations which highlight actionable insights, depending on your actual KPI performance.
Each of the 30 analytics dashboards meets two objectives:
- It provides an in-depth view of the actual performance of the business, such as cycle times for various stages in loan origination.
- It compares those KPIs—at both the product and employee level—against established SLA (service-level agreement) targets. This helps to assess customer or member experience.
Shortfalls and/or inconsistencies among these objectives are highlighted within each analytic display.
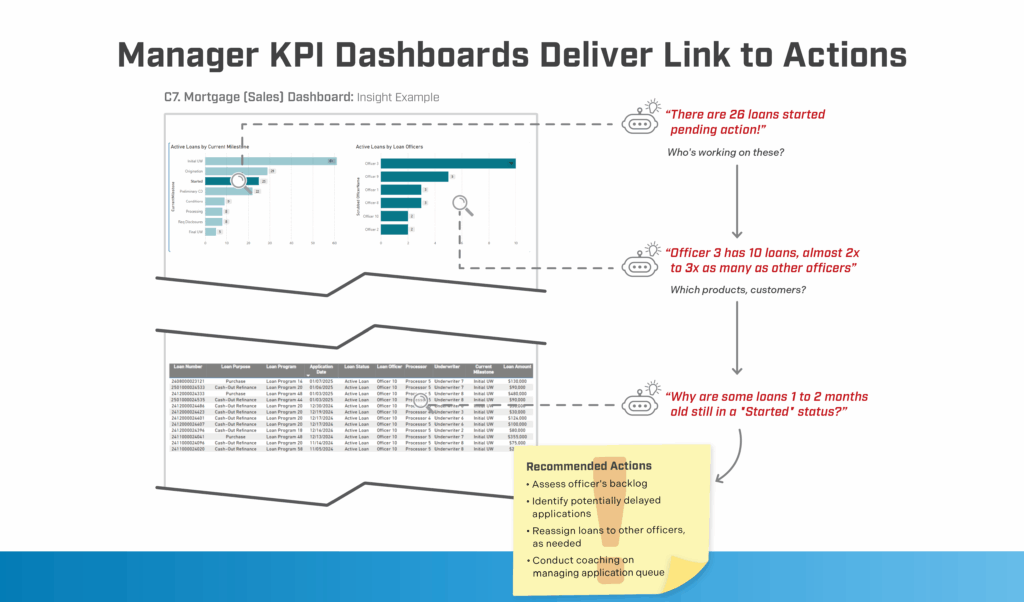
For example, in the image below of a Mortgage Sales management dashboard, we can see three different insights highlighted for manages by the automation:
- Insight 1: In this example, 26 different loans have been “started,” yet are awaiting action before they can reach the next milestone. Which raises the question: “Who’s working on these?”
- Insight 2: Answering the “Who’s working on these?” question, we see the follow-on insight that Loan Officer 3 is working on two to three times more loans than the other officers. Which raises the question: “How does this break out among products and customers?”
- Insight 3: Drilling down to answer the above question (“How does this break out among products and customers?”), we can see that some loans still listed as “Started” have been sitting for one to two months.
The automated analytics then serves up actual recommended actions to take, which include:
- Reviewing Officer 3’s backlog.
- Identifying any applications that may be delayed.
- Re-assigning mortgage loans to other officers as needed.
- Conducting application-queue-management coaching.
See it in action: Watch actual Commercial Lending Sales Pipeline Management analytics and data intelligence from The Lab, demonstrated in this four-minute video.
What is the step-by-step approach for building Manager KPIs for banks and credit unions?
- Access and review existing management reports
- Demonstrate the dashboard template (design only, at this point)
- Complete and gain consensus/sign-off on design use-case
- Connect dashboard to live data source(s)
- Publish dashboard for manager user-acceptance testing or UAT
- Incorporate input from the UAT trial
- Publish the final dashboard
- Complete and hand-off user guides, documentation
Data-Driven Bank/Credit Union Capability 3: Customer and market analytics
The Top 4 navigators for automating insights to increase sales growth, improved margin, and market expansion
Imagine what it would be like if you had real-time data, literally at your fingertips, telling you:
- Which products are the most profitable
- Which customers or members are the most profitable
- Where to find those people and businesses
- How, specifically, to up-sell/cross-sell to these accounts
- And more
There’s no need to imagine; with the four “navigators” for banks and credit unions from The Lab, described below, you’ll have this information, automated, and ready to use in your decision-making every single day—not just “strategically, every few years.”
Watch it in action: Want to see The Lab’s Product and Customer/Member Profitability and Cross-Sell List Generator in a real-world demo? Just watch this four-minute video.
1. Profit Navigator
This automated navigator from The Lab providers powerful insights such as “The top ten percent of products are driving more than 85 percent of net margin.” This navigator:
- Calculates margin and yield, by account
- Aggregates by customer, by product, etc.
- Assigns profitability letter grades (“A” through “F”)
2. Customer/Member Navigator
Now you can get deep-dive insights such as “The top ten percent of customers are driving more than 90 percent of your net margin.” This navigator:
- Segments customers by demographics, firmographics, and even geography (with visual map overlays)
- Identifies cross-tell targets
- Creates sales- and marketing-ready contact lists
3. Prospect Navigator
Reach beyond your current customer base. For all-new customer or member prospects, this navigator:
• Identifies prospects which match the defined demographic/firmographic and geographic criteria
• Creates sales- and marketing-ready contact lists
4. Market Share Performance Navigator
This “navigator” from The Lab helps your bank or credit union to identify which specific products to up-sell or cross-sell to the members, customers, or prospects identified by the previous navigators. This navigator:
- Provides current market-share data, as well as market-share growth
- Pinpoints the top competitive opportunities
Data-Driven Bank/Credit Union Capability 4: Retail network analytics
Get automated insights for optimizing your bank or credit union’s retail branch network
Certainly there are nuances when it comes to individual branch operations:
- A branch manager in, say, midtown Manhattan will have her reasons for staffing and operating her branch in a certain way.
- A branch manager who’s just three blocks south will have vastly different opinions on the subject since his branch operates—according to him—in a “completely different market.”
But what does the data say? Imagine if you had, in hand, hard, inarguable data to optimize the performance of every single branch—and your entire retail network.
Here are four analytics from The Lab to help you accomplish just that.
Watch it in action. See real Bank & Credit Union Retail Branch Network Staffing Model/Cost Reduction analytics from The Lab, demo’ed for you in this engaging 3.5-minute video.
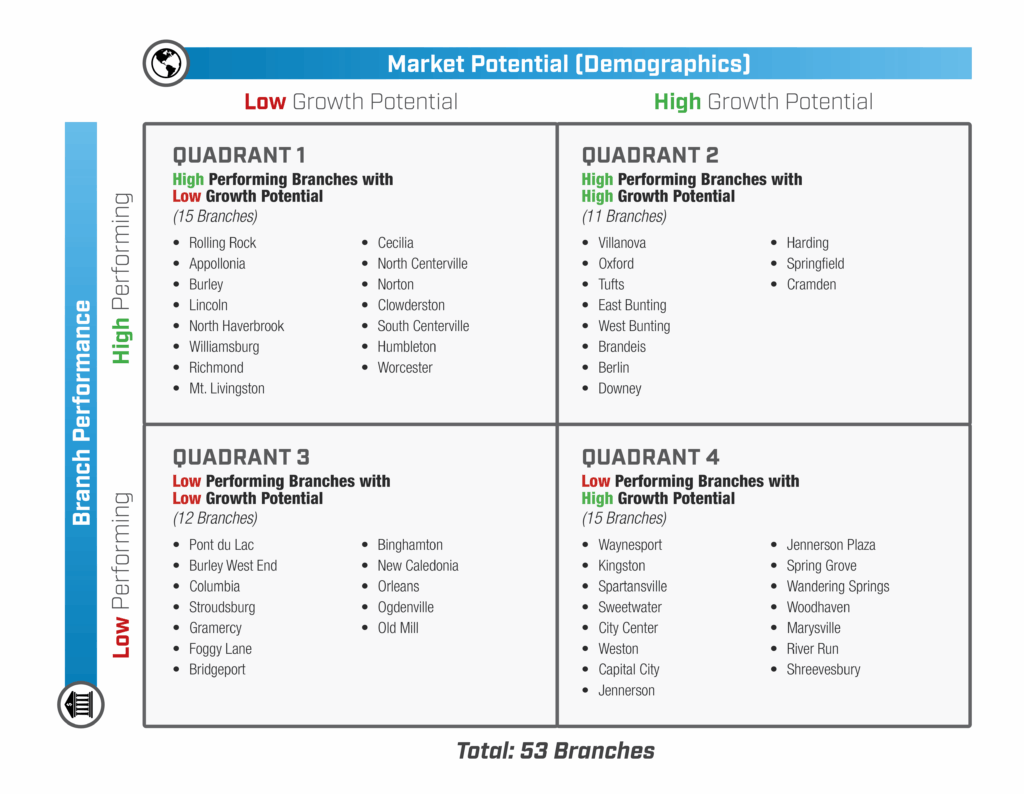
- Retail Branch Comparison Analytics. See instant side-by-side comparisons between different branches; compare how performance and market demographics stack up among locations.
- Branch Scorecard Analytics. Get letter-graded and color-coded ranking of under-performing branches (and their high-performing counterparts). See the highest-potential markets for expansion and/or entrance.
- Retail Branch Staffing Model. As shown in the above-mentioned video, this AI and advanced analytics for banks and credit unions provides the recommended optimum staffing for each branch in your retail network. And it’s adjustable, based on both historical and projected growth.
- Hours of Operation Analytics. This powerful tool aggregates actual branch transaction data—daily and even hourly—to pinpoint opportunities or suggest improved hours of operation.
Best Practice Semantic DATA MODEL
My bank or credit union already has a data lake; why would I need The Lab’s data model?
More often than not, banks and credit unions focus the implementation of their data warehouse/data lake—correctly, we might add—on Step 1: Centralizing all of their data.
That’s great, but they typically stop there. They never get to Step 2—standardizing the data. Indeed, many banks and credit unions don’t realize that Step 2 exists, or that it’s required in order to obtain true data-driven performance in banks and credit unions.
That’s why, whether you have a data lake or not, you will benefit from The Lab’s data model. It works with your existing repository, standardizing the data to be used as your main data source (dare we say it? “single source of truth”) for all of the capabilities we have been describing in this article.
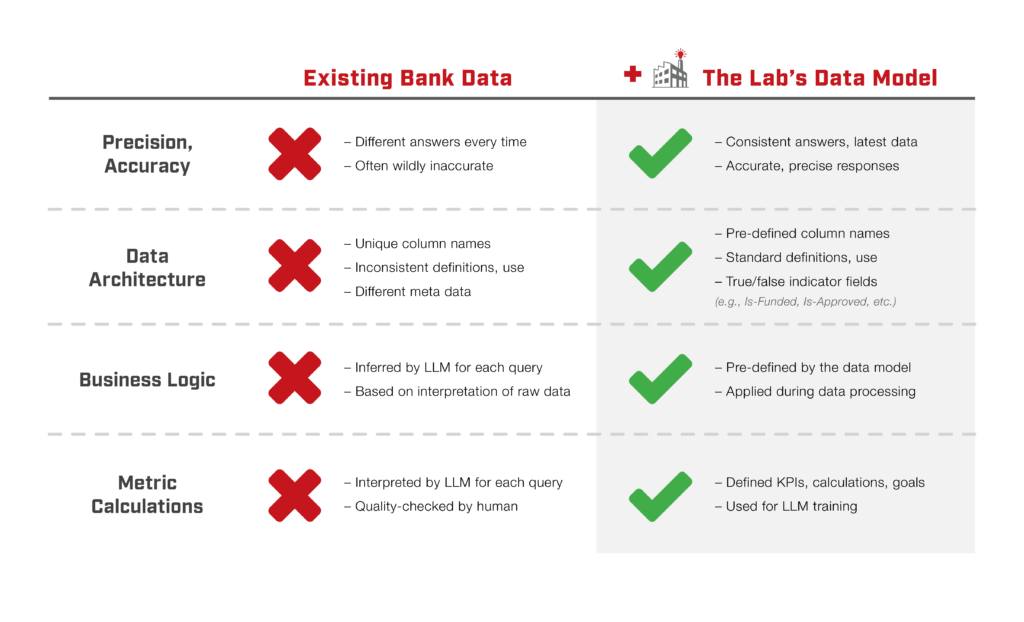
The Lab’s data model standardizes your data, so it’s ready for anything: any cuts, pivots, combinations, or derivatives. And by defining and integrating standards not only for humans, but for automations (i.e., digital workers), both can interpret the data much easier and faster.
And with good data in… you get good data out.
Best Practice 8 STEPS TO INTEGRATE
What is the step-by-step approach for integrating The Lab’s data model in banks and credit unions?
The eight-step process goes like this:
1. Set up standard data tables on the network
2. Create the prioritized data mapping plan and schedule
3. Build data load processes, if needed
4. Load the data—from system(s) or data warehouse—to standard tables
5. Standardize all product categories
6. Standardize all department and cost-center categories
7. Standardize all market/branch categories
8. Hand off the data model and documentation
RESOURCE REQUIREMENTS
What if your bank or credit union lacks the internal resources to integrate this data model?
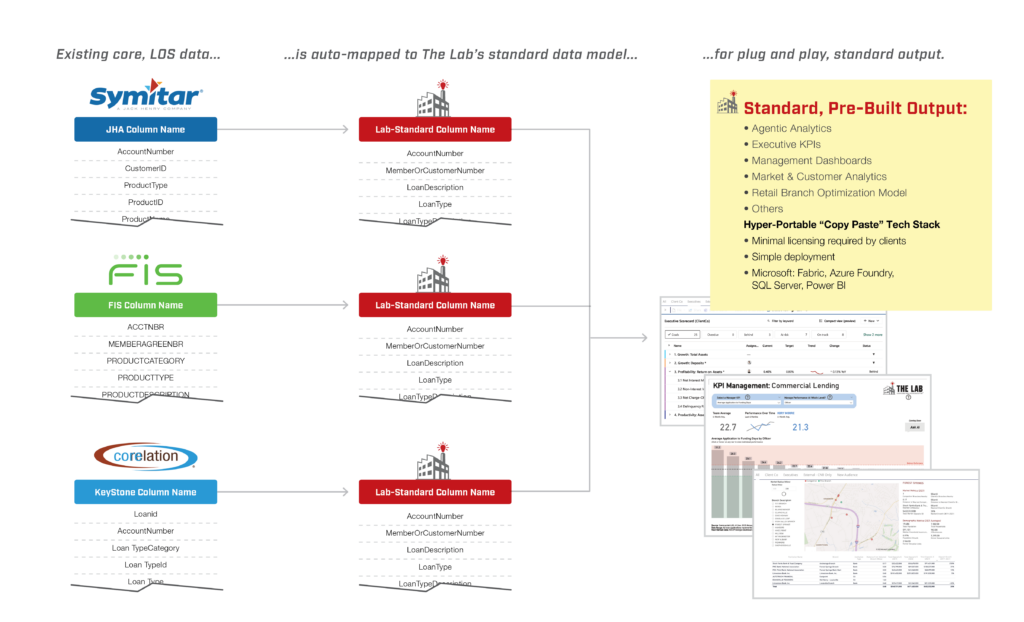
Don’t worry. At The Lab, we’ve template-ized all of this work for you, to the point where it’s practically plug-and-play. Simply grab our templates, and map to your sources, whether they’re your systems or repositories.
Who, then, should do the work? The ideal candidates to employ The Lab’s templates at your bank or credit union would be data analysts who sit within the business. They know the data. They understand the KPIs. They can quickly help to define, refine, and map it to the data model.
But what about your IT department? No, they’re not your first choice. Here’s why:
First, they lack the skills of the data analysts we just described. Second, they’re already jammed; that’s a given. So you’ll only need to tap their assistance at the last mile, making sure that all of the connections are integrated accurately.
And even if you’re still strapped for resources at that point, The Lab can help. Odds are, we’ll complete it in one-fourth the time it would take your analysts. That’s because The Lab’s data scientists have both business and process experience, so they possess the proper acumen to accurately define, refine, and map your data to the data model.
We run the project. We dig deep to find every source. We map them all. We even provide proven teaching methods, for your internal teams, which we have used across thousands of organizations.
OUTCOMES & BENEFITS
What results can I expect by standardizing data at my bank or credit union?
This is no academic exercise. Banks and credit unions that implement these capabilities will see direct benefits in terms of cost reduction and revenue lift. Specifically, the customer and market analytics toolset focuses on your revenue and margin, while the Executive and Manager KPIs focus on cost reduction.
Bank and credit union executives who take charge of standardizing their data as part of their institution-wide strategic transformations can typically see:
- Performance lift: 2x or more
- 2 – 5 additional margin points on new sales
- Capacity alignment and reduction of 20%- 35% in branch network
And then there are the “numbers beyond the numbers.” How many times have you tried to get the answer to a performance-related question by assigning it to an analyst who must drop everything and create an ad-hoc report? And then how often (and you know the answer) do you and your team spend countless hours arguing over the validity and accuracy of the data in that very report? Talk about wasted resources.
Simply saving the time to answer your questions delivers a 2x to 4x return on your data-standardizing investment. And having inarguably accurate decision-empowering data at your fingertips goes beyond measurement.
The Lab Consulting Services
How do I get started standardizing my bank or credit union’s data with The Lab?
If you, too, would like to chat with your data, chat with The Lab first. We’ve been helping peer banks and credit unions for more than three decades, and we’d be delighted to help you, too.
We’ve helped bank and credit-union C-suite executives, business and technology leads, and internal operational-excellence teams to transform their businesses and processes to drive measurable results and deliver successful large-scale transformation initiatives.
Our proven services and solutions—backed by our industry-leading Knowledge Base of 30-plus years’ worth of template-ized, re-deployable client-engagement IP, along with our patented Knowledge Work Transformation™ delivery methodology—can transform your financial institution in as little as six to 12 months.
Ready to transform your data—and your bank or credit union? To book your screen-sharing demo with our friendly experts, all based at our Houston headquarters, call (201) 526-1200 or email info@thelabconsulting.com today.