
How to Process-Map Your Utility’s As-Is Operations
Learn how to map every current-state utility process, from meter-to-cash through vegetation management and outage repair, in just six to eight weeks
Utilities across North America—whether public, investor-owned, co-op, or community choice aggregators or CCAs—face a variety of common challenges. This is the case regardless of the services they provide, whether it’s electricity, natural gas, water/sewer, or any combination thereof. Your utility must:
- Keep pace with surging demand and load growth
- Navigate constraints in supply chain and capital costs
- Contend with a retiring workforce, requiring the onboarding and up-skilling of teams
- Modernize to provide greater resilience to customers
Executives at utilities, then, should commence any transformation initiative with process-mapping of the as-is state of their utility’s operations from end to end or “E2E.”
Your utility’s sought-after future state will naturally include capabilities like agentic AI, the onboarding of a digital workforce, and advanced data intelligence and predictive analytics. But you clearly can’t chart this future state until your utility’s current state is mapped in detail.
In this “explainer article” from The Lab, we will give you the tools and information you need to create detailed process maps of your as-is utility operations.
Which external forces are impacting your utility’s as-is processes?
Trends which affect your utility’s process maps
The challenges we’d noted above—such as supply-chain constraints and up-skilling existing teams—are chiefly internal. Yet there are even more external challenges facing utilities than perhaps any other industry sector. To name just a few:
- New trends in load growth: everything from industrial electrification to the voracious energy needs of AI data centers.
- The need to modernize the grid and maintain reliability via approaches such as distributed energy resources or DERs in the light of surging demand and extreme weather.
- Defending against burgeoning cybersecurity threats, wherein the exposed attack surface is a part of the country’s critical infrastructure.
- Keeping pace with emerging regulatory pressures, which have boomeranged between state and federal de-carbonization/renewable mandates on one hand—and deregulation/delayed retirement of fossil fuel plants on the other.
- Changes and updates in core and ancillary systems, everything from customer information systems or CISs, to outage management systems or OMSs, and more. And whoever said that these systems talk to each without human help? They don’t.
- As if all of the above weren’t enough, there’s the persistent pressure to keep utility prices affordable for rate-payers—amid costly upgrades and constraints imposed by federal regulators and state utility commissions.
Given all of these concurrent challenges, you simply can’t grasp your utility’s future state without those as-is E2E process maps in-hand.
How to put process before technology in utility process mapping
Process-map your utility as-is operations; maintain your tech stack
This long-form explainer article from The Lab isn’t just for utility C-suite executives. It’s also for technology or business-unit leads, as well as internal improvement teams that are tasked with finding and exploiting every possible operational improvement opportunity.
The Lab’s patented approach puts process before technology; this is how it has helped leading utility executive sponsors and their teams. It allows for the incremental addition of capabilities like agentic AI and robotic process automation or RPA (also known as digital workers). And it make this possible without an expensive replacement of your utility’s various systems, including:
- CIS: Customer information system
- GIS: Geographic information system
- EAM: Enterprise asset management
- SCADA: Supervisory control and data acquisition
- OMS: Outage management system
- ADMS: Advanced distribution management system
- MDMS: Meter data management system
- AMI: Advanced metering infrastructure
- ERP: Enterprise resource planning
Given the complexity of a modern utility operation, you’ll be pleasantly surprised to learn how your as-is processes can be mapped by The Lab in only six to eight weeks, as we will detail in this article.
Tools to use, pitfalls to avoid
Best process mapping for utilities
Your goals for E2E process mapping are straightforward. Whether you do the mapping yourself, or with the help of a consulting partner such as The Lab, you’ll want to analyze, scrutinize, and visualize your processes. You’ll want to uncover opportunities for process improvement, automation, and agentic AI in utilities. You’ll want to shine a spotlight on wasted effort and resources. You’ll want to track your key performance indicators or KPIs. And you’ll want to do this for all of your workflows—as we will discuss in detail later in this article.
With all of this detail in-hand, you’ll take the first step toward that future state, in which you can cut costs, increase scalable capacity and operating leverage, elevate customer service, increase risk management and regulatory compliance, and improve the customer experience.
In this detailed deep-dive explainer, we’ll show you how to process map your utility’s as-is operations. You’ll see which pitfalls to avoid. You’ll see the different mapping tools that are available. You’ll even learn how you can increase executive KPIs, often by complete quartiles, in less than a year. The Lab has been helping utilities executives and their reports for more than three decades; our unique Knowledge Base has captured all of our client-engagement IP into a semantically structured database of tools, templates, and code—all configured for rapid rollout to you, ensuring maximum benefits.
Defining process mapping for public utility operations
How is “process mapping for utilities” defined?
For your utility, we can define “Process Mapping” this way:
Process mapping for utilities means creating a visual diagram, resembling a flow-chart, which graphically represents all of the tasks and activities which comprise your utility’s processes from end to end.
A proper process map breaks down intricate processes into basic “building blocks” and steps, clarifying the process while adding opportunities for process improvement. And by showing what is being performed in your utility, it simultaneously shows what you can improve.
Process Mapping Step By Step
The 3 Essential Steps of Public/Private Utility Process Mapping
Preparing for the actual process mapping in your utility takes a lot longer than the “six to eight weeks” we’d mentioned at the outset of this article. It represents the first of three essential steps of process mapping in utilities:
Process mapping for utilities essential step 1: Planning the strategy
This is the long “prep” phase we had just mentioned; utilities will often devote anywhere from 3 months to 1.5 years to these steps:
- Getting departmental and organizational consensus
- Finding a C-suite executive project sponsor
- Finding a utility- or business-unit-wide situation which needs remediation
- Defining the strategic outcome desired from the process mapping project
- Creating a benefit-rich cross-functional scope of effort
Process mapping for utilities essential step 2: Documenting activities, drawing maps
This is the fun step. When you work with The Lab, you can complete this step in just six to eight weeks:
- Gather all SOPs and procedures
- Inventory all systems in use; list their data types
- Interview subject-matter experts (SMEs)
- Document specific tasks at the 1-5 minute level
- Conduct Map Fair to get more improvements
- Catalog and “taxonomize” identified future-state improvements
- Write up the business case for the utility transformation plan
Process mapping for utilities essential step 3: Implement the improvements
This step takes about three to 12 months:
- Create the implementation/support teams
- Standardize utility business processes
- Improve data quality
- Reduce/eliminate wasteful and/or redundant processes
- Layer in agentic AI, robotic process automation, advanced data analytics, and automated reporting
- Use KPIs to monitor and track the effort, sustaining its progress
Can you process map your utility internally?
Is it better to process map your utility using internal or external resources?
When it’s a component of a massive process-improvement initiative—or perhaps during an M&A situation or while onboarding major systems—the largest utilities in America generally use outside firms for process mapping.
Similarly, most mid-sized utilities lack internal process-mapping capabilities, having neither the teams nor the talent in-house.
Process Mapping Resources (Part 1)
Who inside your utility is best to do process mapping?
Your utility may have its share of Lean Six Sigma Black Belts. It may have a mature internal improvement capability. If you can check these boxes, then you probably have people, in-house, who can process-map for you. (More on this shortly, but you won’t find them in your IT department.)
Look for people with titles such as:
- Business Analyst
- Process Engineer
- Director of Operational Excellence
As you expand your utility’s process-mapping effort, you’ll want to seek out data scientists (ideally within your organization) who have process experience; they can then make the move to Business Analyst.
Process Mapping Resources (Part 2)
Which external consultancies are best for process mapping your utility?
Many utilities prefer to use an external process-mapping specialist like The Lab, since they know they will get better, and faster, results. The Lab can effectively run the utility’s process-mapping initiative from soup to nuts. This includes creating the actual as-is maps, and using teaching techniques which have been refined over more than 30 years’ worth of client engagements.
The Lab’s Knowledge Base harnesses all of that experience in the form of standardized:
- Templates
- KPIs
- Tools
- Best practices
- AI and RPA use-cases
- Automation code
- More
The templatizing of these assets is what enables such rapid rollout and ROI.
Be sure to check out some of The Lab’s articles for utilities leaders.
Top tools for utilities process mapping
Which software tool works best for process mapping my utility?
Broadly, there are two categories of tools at your disposal when it comes to process mapping your utility: 1) Digital/software tools and 2) “Old-school” manual tools. Here’s a quick overview of these two buckets:
Digital software tools for creating public utility process maps
- Blueworks from IBM. This software platform (based in the cloud) lets you process-map your utility. But it’s an IBM “walled garden” product, and thus not terribly ubiquitous.
- Visio from Microsoft. You have Visio, because you have Microsoft. Visio is the undisputed process-mapping leader for over a decade. And it’s easy to get, thanks to your Office 365 bundle.
- Signavio from SAP. Yep, SAP purchased this cloud-based platform back in 2021. It’s a wholly serviceable process-mapping platform, along with other Visio competitors such as Miro, Lucidchart, and Diagrams.net.
Physical tools for creating public utility process maps
- Butcher paper. White or brown paper rolls, often favored by traditional process-mapping consultants, are big, fast, and easy to annotate with sticky notes.
- Office white boards. Wall- or easel-mounted whiteboards are a classic go-to for utility process-mapping. You can draw in lots of colors, super fast. You can erase and make changes on the fly. They’re great for group meetings.
Process mapping for public utilities: How to choose the best partner
What are the advantages of using a consultancy like The Lab for process mapping investor-owned utility operations?
The Lab’s approach to process mapping for utilities has been honed over the course of more than three decades, and is designed to eliminate the delays and pitfalls of common methods.
The benefits of process mapping your utility with The Lab include:
- Faster mapping. Your utility’s subject matter experts will only be needed for one to two hours per week, over 6 to eight weeks.
- More detail. Get validated capacities of each business process and department, replete with a detailed implementation benefits case.
- Best practices. The Lab will benchmark your utility vs. peers, to help you see where you stack up—and identify best practices to implement in the to-be state.
- More benefits. Identify opportunities for AI, automation, automated KPI reporting, new/improved control points, improved compliance/reporting opportunities, reduction of redundant rework, and more. This is all possible with E2E process mapping from The Lab, documented at the individual activity level of detail.
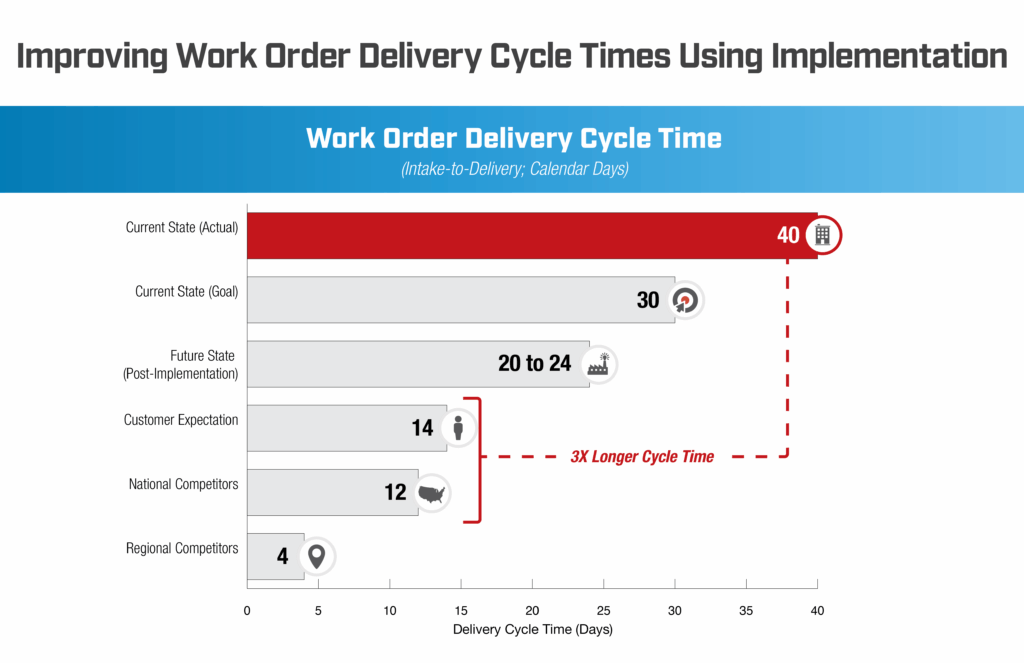
Check out this great case study from The Lab of how one of our utilities clients was able to reduce work-order cancellations by 50%.
How should you determine your process mapping scope?
What’s the best technique for scoping a utility process-mapping initiative?
Regardless of size, geography, customer base, and regulatory environment, different utilities are more alike than different, especially when it comes to process mapping their constituent activities.
This simplifies your task when it comes to scoping out your utility’s project-mapping undertaking. Activities at “Utility A,” such as meter-to-cash or utility locating, will be quite similar to those at “Utility B.” Ditto for activities such as vegetation management and even fleet management. Indeed, the differences will depend primarily upon the way the original workflows were configured in the different systems by the implementation teams who’d set them up.
If it weren’t clear already, this bolsters the benefit of working with The Lab, and our templatized approach which has been honed across countless utility client engagements.
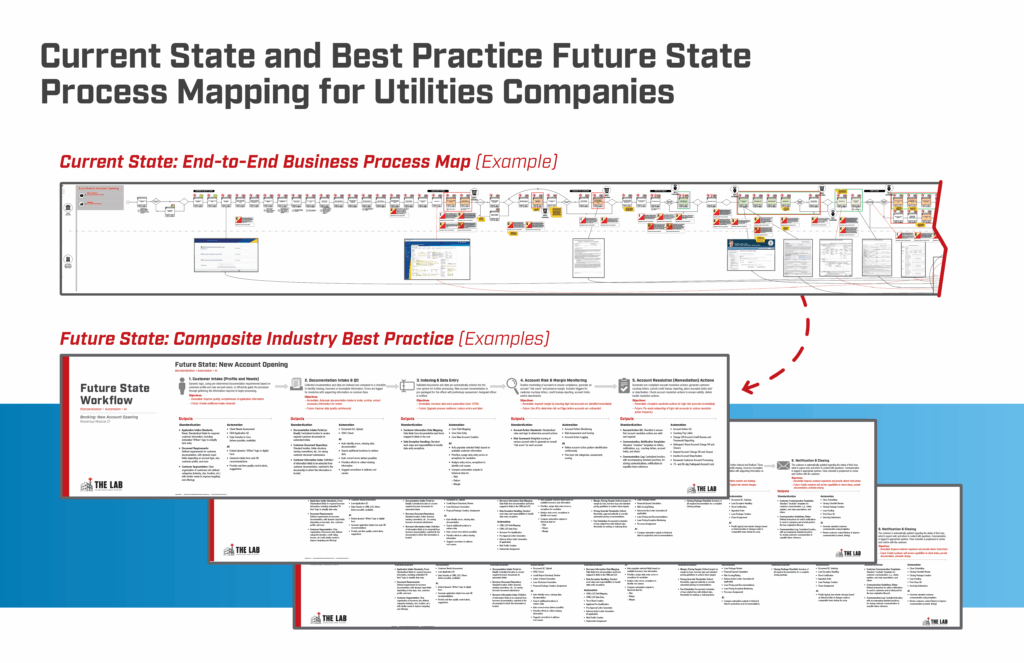
While process maps certainly vary by organization, a representative E2E process map can be seen below:
[“Enterprise-wide scope” illustration]
Process Mapping Best Practices
Best-practice techniques for process-mapping scope in utilities
Be sure to pay heed to these four best practices when scoping our your utility’s process mapping initiative:
- C-suite sponsor. Make sure you’ve got sponsorship from the top. This will pre-empt any internal organization’s excuse to “not participate.”
- Stay benefits-focused. Make sure that your process map’s scope includes all business functions and departments, to deliver maximum ROI.
- Map the complete customer journey, as well as the complete setup process, back-office operations, and all regulatory and/or compliance activities. Be sure to take apart any silos which may limit this wide-ranging scope.
- Include all end-to-end sub-processes, such as:
- Meter-to-cash starting with order intake (confirmation, credit, work order), all the way through meter reading, billing, payments, and collections.
- Utility locating including pre-field research, on-site marking, and reporting.
- Outage management including outage detection, crew dispatch, repair operations, and communication.
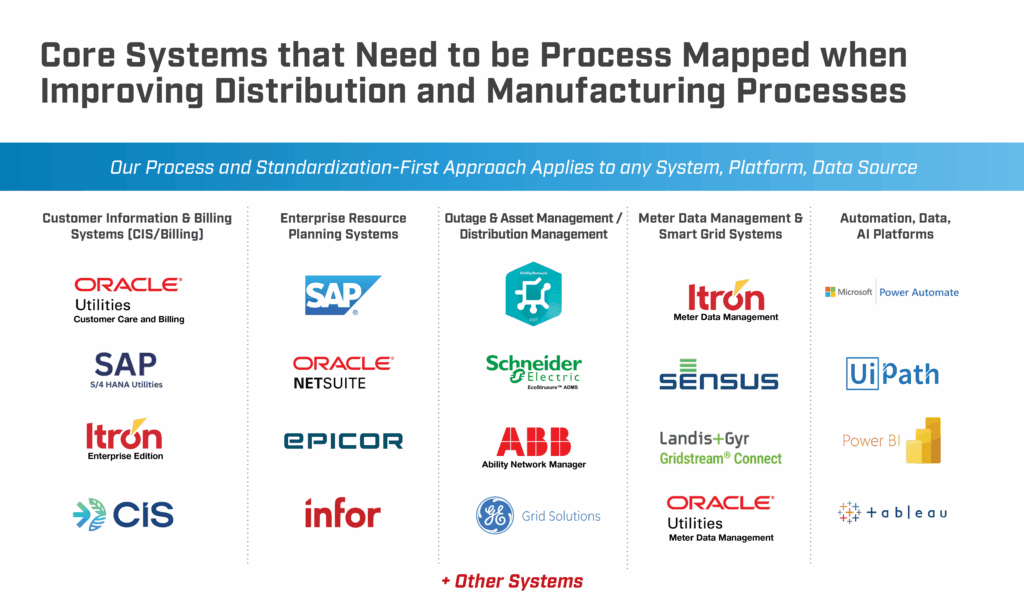
Systems Included In Process Mapping (All)
Utility process mapping must include all systems used
Utility process mapping must include all systems used
Your utility process mapping should encompass all of the systems you employ, including:
- Enterprise Asset Management/Work Management
- Supervisory Control and Data Acquisition
- Customer Information System
- Geographic Information System
- Advanced Distribution Management System
- Outage Management System
- Advanced Metering Infrastructure
- Meter Data Management System
- Enterprise Resource Planning
- Others
By including all of the systems your utility uses in your end-to-end process map, you’ll ensure that you gain the maximum enterprise lift from your effort.
Fastest approach to process mapping for public and investor-owned utilities
Process map your utility operations in six to eight weeks
The Lab’s patented Knowledge Work Transformation™ methodology, template-based approach, and intensely process-focused team allow for the fasted possible mapping of your utility’s current-state end-to-end processes.
In fact, The Lab can document all end-to-end business processes in your utility, in only 6 to 8 weeks. Each activity is documented down to the 1-5 minute detail level.
When The Lab maps the wall-to-wall processes of your utility, we also layer atop it all of the relevant operational details, including:
- System usage
- Customer touch-points
- Job roles: Office + field
- “NIGO” or “not in good order” activities and data
- Redundant effort and over-service
- AI/automation use-cases
- Standardization opportunities
- Others
Remember, also, how we’d mentioned earlier that The Lab’s process-mapping approach only requires about one to two hours of your SMEs’ time each week. So you can keep the lights on during the mapping… even as you’re keeping your customers’ lights—or water or gas—on, too.
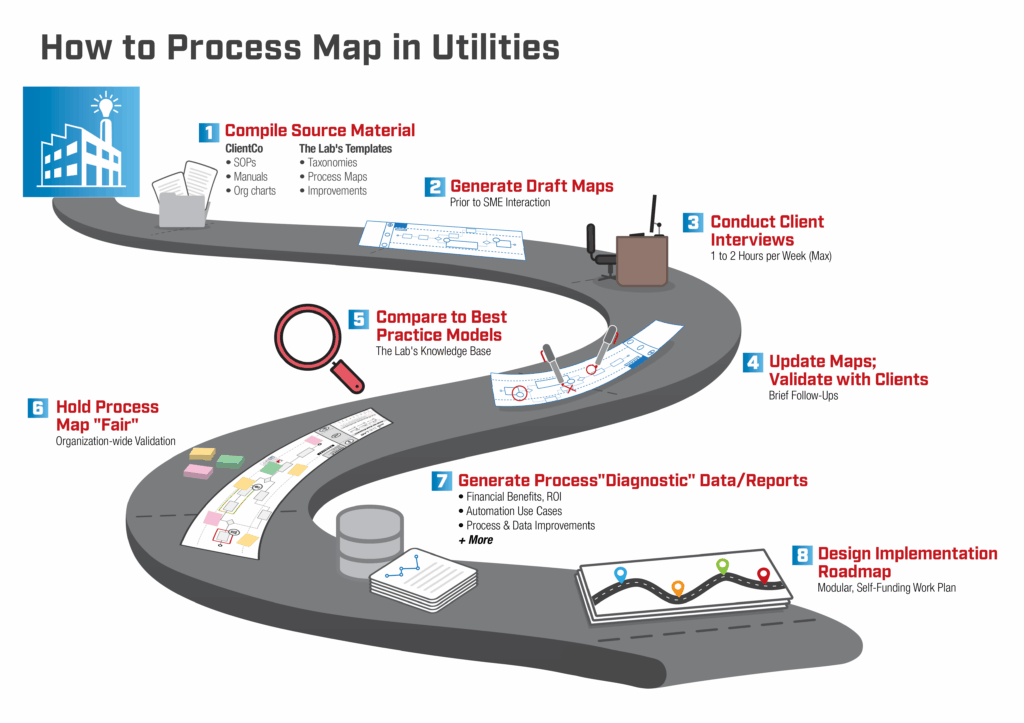
Process Mapping Step by Step
What steps should your utility follow for process mapping?
The Lab employs an eight-step process-mapping approach, which adheres to best practice. It goes like this:
Step 1
Utility Process Map First Step: Gather all relevant input
When you engage The Lab to perform as-is process mapping of your utility’s operations, we’ll first request a lot of information: Org charts, SOPs, process procedures, policy manuals, previous operational reporting outputs, and more.
Its age or condition doesn’t matter. It could exist in partial PowerPoints or sprawling Excel datasets. The reason is what we’d hinted at several times already: The Lab wants to be as respectful as possible of your SMEs’ time, so we ingest this data before we engage with them.
The Lab will also request data extracts from all the different systems your utility uses. We want it redacted/stripped of customer info. We don’t need that level of sensitive detail to reveal operational performance trends such as:
- SAIDI: System Average Interruption Duration Index
- SAIFI: System Average Interruption Frequency Index
- SAIDI/CAIDI: System/Customer Average Interruption Duration Index
- Meter Reading Accuracy
- Water Loss or Leakage Per Connection
They can also reveal financial and asset-management metrics such as:
- Operating Ratio
- Return on Equity/Assets
- Debt-to-Equity Ratio
- Debt Service Coverage Ratio
- ARPC: Average Revenue Per Customer
- Asset Turnover Ratio
- Maintenance Cost per Unit
And they can also show customer-service KPIs like:
- Average Response Time
- FCR: First-Contact Resolution
- CSAT: Customer Satisfaction Score
The data which The Lab collects will be compared to the process maps, and used to create a capacity model for the organization. It will also be used to build a quantified business case for implementation, since The Lab, at its core, is an implementation firm.
The Lab’s Knowledge Base has scores of utility-relevant templates, such as:
- Taxonomies
- Process maps
- Process improvements
- Agentic AI + automation/RPA (robotic process automation) use-cases
- Utility-specific KPIs
- Benchmarks
- Re-org
- Standardization opportunities
- Best practices
Step 2
Utility Process Map Second Step: Drafting of Version 1 Process Map
Using all of the data from Step 1, The Lab will then draft the v1 process map. If you’re paying attention, you’ll realize that The Lab has not engaged with your SMEs yet. That will happen after this step.
Using specially programmed bots, The Lab drafts the process maps in Microsoft Visio. Using this ubiquitous mapping application makes it easy for The Lab to hand off the maps to your team, who can easily alter or update them in the future. (We understand that utilities don’t want consultants hanging around indefinitely!)
Using MS Visio confers another benefit: It saves your utility from the cost and hassle of onboarding yet another software vendor.
Step 3
Utility Process Map Third Step: Interview Subject Matter Experts
Finally! We’d teased this step seemingly forever in this article. But now that the v1 process maps have been drawn, The Lab will work with your subject matter experts or SMEs who perform the day-to-day operations of dispatch, billing, field operations, fleet management, utility locating, and more.
The Lab will share the first-pass maps with them and get their feedback: What’s missing? What’s inaccurate? The Lab will only require about an hour or two, per week, per SME, for this activity.
Step 4
Utility Process Map Fourth Step: SME Interview Lather/Rinse/Repeat
The Lab has learned, over the course of three-plus decades, that no SME can fully remember every single step of a given process, at one sitting. That’s why we iterate Step 3, multiple times, in Step 4. This provides the best level of detail generation, while being as respectful of your SMEs’ time as possible.
With each review, we update the maps. This cadence continues in brief bursts over the course of about four weeks.
Step 5
Utility Process Map Fifth Step: Best-Practice Comparison
Next, The Lab will compare the polished process maps to best practice from peers, in order to craft the maximum-value future state to implement.
The best-practice models included in The Lab’s Knowledge Base feature:
- Utility benchmarks
- KPIs or Key Performance Indicators
- Automation and digital workforce/agentic AI use cases
- Best-practice process improvements
- Job and role descriptions
- Process/data-standardization opportunities
- Opportunities for reorganization
Step 6
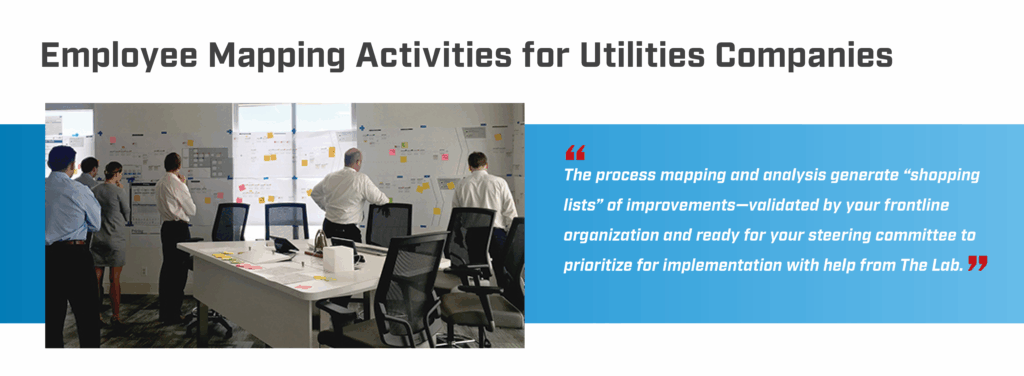
Utility Process Map Sixth Step: Utility Map Fair
At this point, The Lab will print out huge, wall-mountable versions of the SME-validated/polished process maps, so that everyone within the utility can view them, and add to them. This is the essential two-day on-site Map Fair, typically held at the utility’s headquarters.
Everyone is free to visit, and to comment, via color-coded sticky notes: Green for “Agree,” Red for “Disagree,” and Yellow for “Here’s missing information that you need.” Workers needn’t “sign” the sticky notes; they can contribute anonymously if they wish.
The Map Fair will validate the maps’ underlying fact base. It socializes its findings. It preps the organization for the upcoming implementation-based transformation. And it ensures buy-in, since everyone has had the opportunity to review and contribute. So its output is inarguable.
Once the Utility Map Fair is over, The Lab will integrate all of the sticky-note inputs and update the map accordingly. At this point, the process map is complete.
Step 7
Utility Process Map Seventh Step: Capacity Modeling
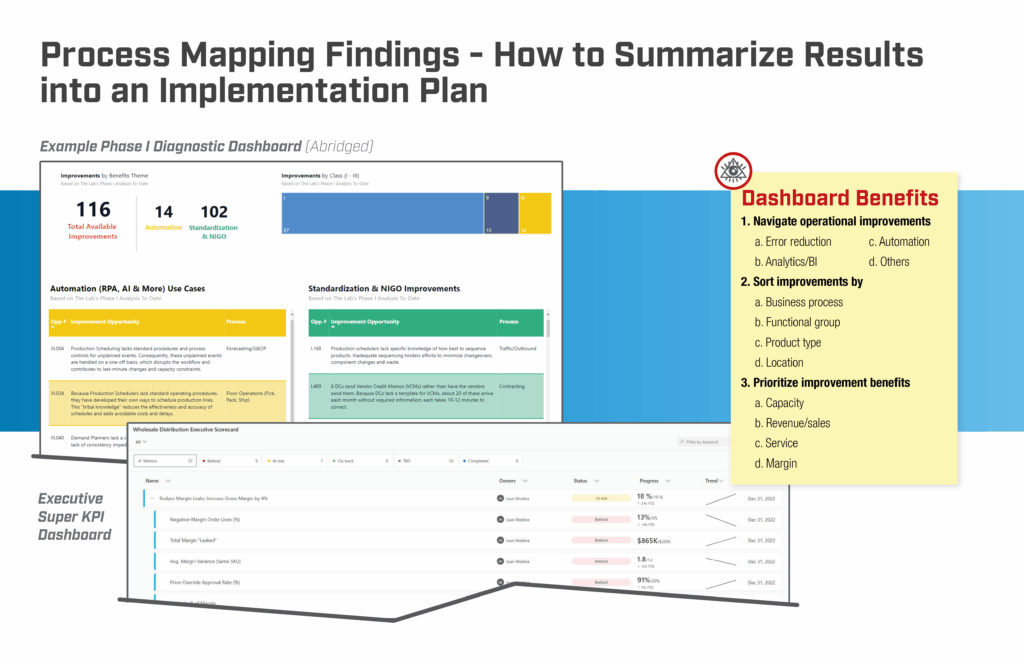
The Map Fair will provide a veritable “fire hose” of improvement opportunities. The Lab typically sees:
- Some 101 – 201 use-cases for agentic AI and robotic process automation
- Some 151 – 251 opportunities: Process/data standardization
- Some 51 – 101 advanced analytics/data intelligence use-cases
All of these identified improvement opportunities will be organized, by The Lab, into a central data base, structured for easy and intuitive navigation. The Lab also creates an executive dashboard, in Power BI, to help your utility to see, plan, and prioritize the opportunities to implement.
Each improvement opportunity is also quantified, according to its:
• Time savings
• Financial benefits
• Elevation of customer experience
• Technology underutilization
• Others
After The Lab completes the quantification of all these improvement opportunities, we then create an organizational capacity model which serves as a baseline for your utility: It’s used to calculate the business case, and the value, of modules, work plans, and implementation. Outputs include:
• Process improvement
• Financial benefits
• ROI
• Data improvement
• AI use-cases
• RPA use-cases
• Others
Step 8
Utility Process Map Eighth Step: Implementation calendar
Over the course of more than three decades, The Lab has discovered that public and investor-owned utilities are best served by employing a modular approach to implementing identified improvements. These should tee up to both short- and long-term strategy goals. And that’s despite the common initial temptation of: “Let’s implement them all, all at once!”
Working with our utility client sponsors and their teams, The Lab helps with implementation in the beginning; by the end, the clients are able to self-implement.
[“Creating an implementation roadmap…” illustration]
Eighth Step outputs include:
- Optimum blend of AI, process improvement, automation, and KPI analytics
- Modular, self-funding work plan
- Schedule arranged by business quarters
- Jointly designed by The Lab and the utility’s executive steering committee to meet its stated strategic objectives
There are exceptions to the “avoid the big-bang approach” rule; some business situations require it. Not to worry: If this describes your utility, know that The Lab has supported some of the country’s biggest re-orgs amid turbulent times, as needed.
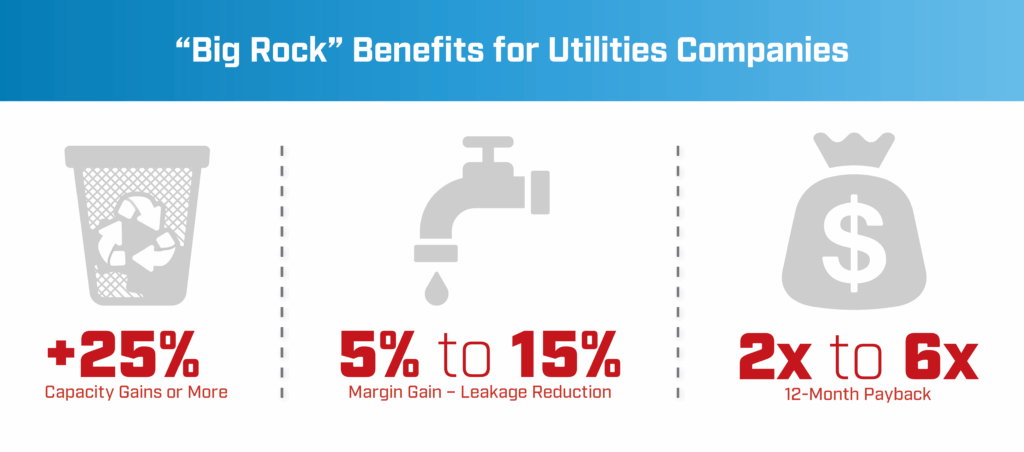
Top 5 Benefits to Process Mapping
What are 5 biggest benefits for utilities that process-map their operations?
Contact us today to book your demo
Are you ready to transform your public or investor-owned utility?
Reach out to The Lab to book your demo. We’ve been helping utility C-suite execs, business-unit leads, technology leaders, and internal-improvement teams to map all of their processes and customer journeys. We’ve empowered them to streamline operational activities, improve customer satisfaction, and reap substantial cost savings.
The Lab identifies and implements agentic AI, digital workers/RPA automation and advanced KPI analytics, data intelligence, and automated reporting. These improve operating leverage, and also hedge against employee turnover. Our comprehensive solutions deliver measurable results and drive success.
Ready to transform your utility? Book your screen-sharing demo by calling (201) 526-1200 or emailing info@thelabconsulting.com today.