Data Standardization Techniques for Insurance Carriers, Agencies, and Brokerages
Learn how AI for insurance, with advanced analytics, KPIs and automation deliver strategic benefits
• Increase your insurance organization’s performance 2x – 5x
• Align capacity to actual work; automate the rest
• Improve policyholder experience & service
As an insurance C-suite executive—whether at a carrier, brokerage, or agency such as MGA or MGU—you’re well aware that your organization is sitting on a mountain of data. You’re likely past the “landfill” of data stage, and are at some step of the journey to pull it all together, from all your different systems, into a single, centralized data lake or warehouse. And you likely have the help of your technology leads, and perhaps internal improvement teams, too.
But just creating a data lake isn’t enough for your insurance operation to reap the benefits of Executive KPIs, AI, and automation. Wouldn’t you love to be able to say “Hey, Siri!” to your data? When you take your data to the next level—that is, standardize it for automation—then you can do just that. And a lot more:
- You’ll be able to use your data to get instant decision-empowering insights.
- Not just you: Anyone in your insurance organization will be able to “chat with the data,” and have a real dialogue. They can ask questions in plain English—and get valuable answers, in plain English, in return.
- Drop-everything ad-hoc reports become history. As do the days of tasking your data experts to analyze them.
- Remember “data standardized for automation”? That allows you to onboard digital workers—a.k.a. bots, a.k.a. robotic process automation or RPA in insurance—who perform repetitive tasks upstream… enabling even more automation, of even more activities, downstream. It’s a virtuous cycle; be sure to check out The Lab’s article about automation for insurance.
The Lab’s unique Knowledge Base—which harnesses more than three decades’ worth of actual client-engagement IP—contains a wealth of template-ized assets, ready for rapid rollout to your insurance organization. These include pre-fabricated:
- Advanced analytics dashboards
- Data-standardization models
- Agentic AI
- Insurance-industry-specific Executive KPIs or “key performance indicators”
(Spoiler alert: We also have the “vital few” Executive KPIs for insurance available for download.)
In this long-form explainer article from The Lab, we’re going to help you learn about, implement, and benefit from data intelligence, advanced analytics, and business intelligence or BI for insurance.
The Top 4 data-analytics capabilities in insurance
What analytics capabilities are must-have for insurance?
When you take charge of all of the data in your insurance brokerage, carrier, or agency, you gain numerous new capabilities by standardizing it and making it automation-ready. Specifically:
- Insurance Data Capability 1: Brokerage/agency network insights. You’ll be able to see performance metrics right down to the individual agent level. You’ll be able to pinpoint root causes of issues, and even get proactive solutions to them.
- Insurance Data Capability 2: Market and policyholder analytics. Get deeper insights into who your policyholders are: which lines and products they have, and where they’re ripest for up-sell and cross-sell. Spot market trends. Improve prospecting and sales.
- Insurance Data Capability 3: “Vital few” KPIs for executives. See the numbers that matter, when you want (you can even ask for them, literally just by talking) which show your insurance organization’s state of health. And of course, every metric allows for instant drill-down into root causes and actionable insights.
- Insurance Data Capability 4: KPIs for managers. From prospecting through quote-to-bind, to policyholder service and claims processing, you’ll get metrics that improve day-to-day operations management. They’re essential for improving performance across the board.
Use Existing Investments In Tech
Will you need a new data warehouse in insurance to standardize your data?
Most insurance executives get apprehensive when we talk about standardizing all of their data; many, after all, have invested heavily in data lakes and warehouses.
Good news: You don’t need to re-invest, or rip-and-replace, any of your systems to get the capabilities we just described above. The Lab’s Standard Data model makes this all possible; it works with your existing insurance brokerage or carrier’s existing data lake.
What if you’re not that far along in your insurance data evolution? Not to worry: The Lab’s Standard Data Model can do it all for you. This article will provide more detail and real-world examples as it goes.
Want to get a jump-start on seeing what advanced data standardization can do for your insurance organization? Look no further than this compelling four-minute YouTube video from The Lab. Its name says it all: “Executive KPIs for Insurance Brokerage, MGA/MGU, and Carrier: Automated Data Standardization and AI.”
Let’s take a deeper look at the different insurance-data-driven capabilities we’d listed earlier.
Insurance Data Capability 1: Brokerage/agency network insights
Optimize your insurance operation’s branch/agency network with automated insights
Consider the differences which reach the home office from the agents and agencies in the field:
- An agency manager in, for example, midtown Chicago will want to staff his office in a certain way—and have his own specific reasons for doing so.
- Yet an agency branch manager just seven blocks north may harbor wholly different opinions on the exact same subject, since her office operates—according to her—in an “entirely different market altogether.”
Each of these managers has opinions which are well-formed, in their minds. But imagine if you could compare apples-to-apples data to help you maximize the performance of every branch, agency, and office in your network.
These template-based analytics tools from The Lab give you exactly that kind of super power:
Watch insurance analytics from The Lab action. See real P&C Insurance Claims Payout Performance AI + Advanced Analytics from The Lab in this compelling three-minute YouTube video.
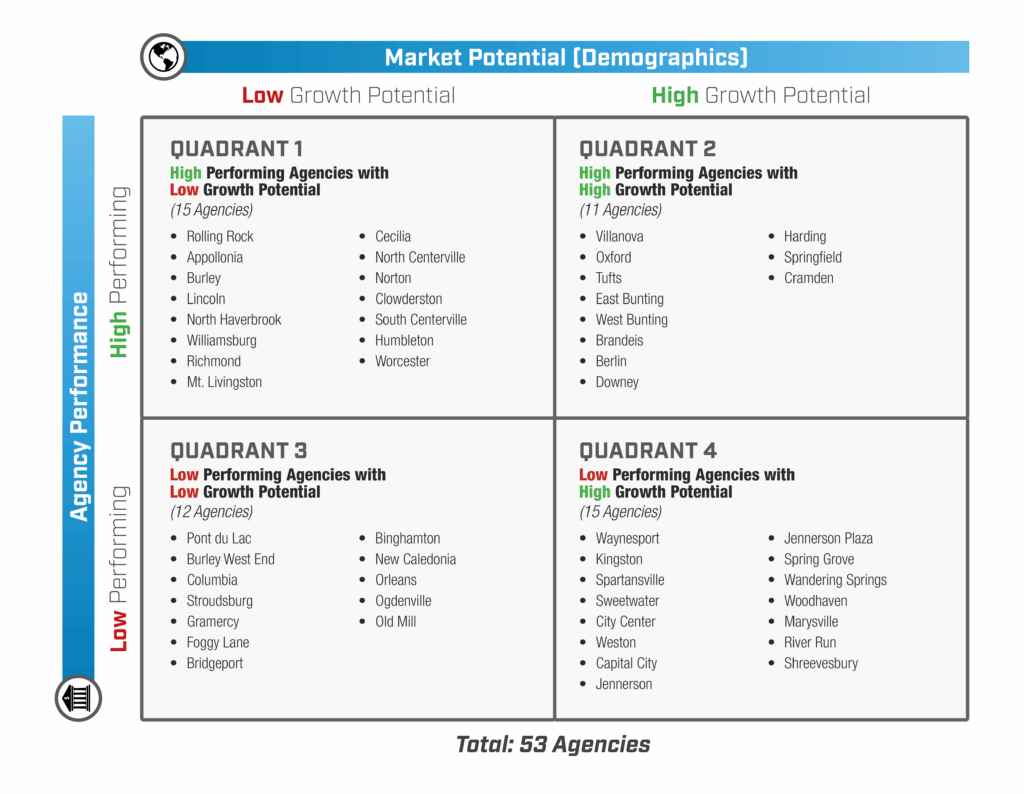
- Analytics for insurance brokerage/agency score-card. This analytics tool from The Lab provides letter-graded and color-coded ranking of under-performing brokerage/agency branches. It also reveals the highest-potential markets for potential expansion or entrance.
- Comparison analytics for insurance brokerage/agency locations. This insurance analytics tool from The Lab gives you instant apples-to-apples comparisons between different brokerage or agency locations. It lets you compare performance—and market demographics—between them.
- Insurance analytics retail agency/brokerage location staffing model. This AI and advanced analytics tool for insurance delivers the optimum recommended staffing for each location in your agency or brokerage network. You can even adjust its sliders, to see how it responds to projected growth.
Insurance Data Capability 2: Market and policyholder analytics
How do you “navigate” your way to insurance market expansion and increased sales/margin?
It may seem far-fetched in your insurance carrier, brokerage, or agency today, but it’s actually quite possible to have real-time answers to questions like:
• “Which of our insurance products generate the most profit?”
• “Which policyholders are our most profitable ones?”
• “Where can we find these specific people—and businesses?”
• “What’s the best way to cross-sell (or upsell) to these policyholders?”
With the four “navigators” from The Lab, detailed below, you can get at-your-fingertips answers to these questions, and more—any day, any time. No more need to request drop-everything ad hoc reports… or wait for the next “strategy summit,” years down the road.
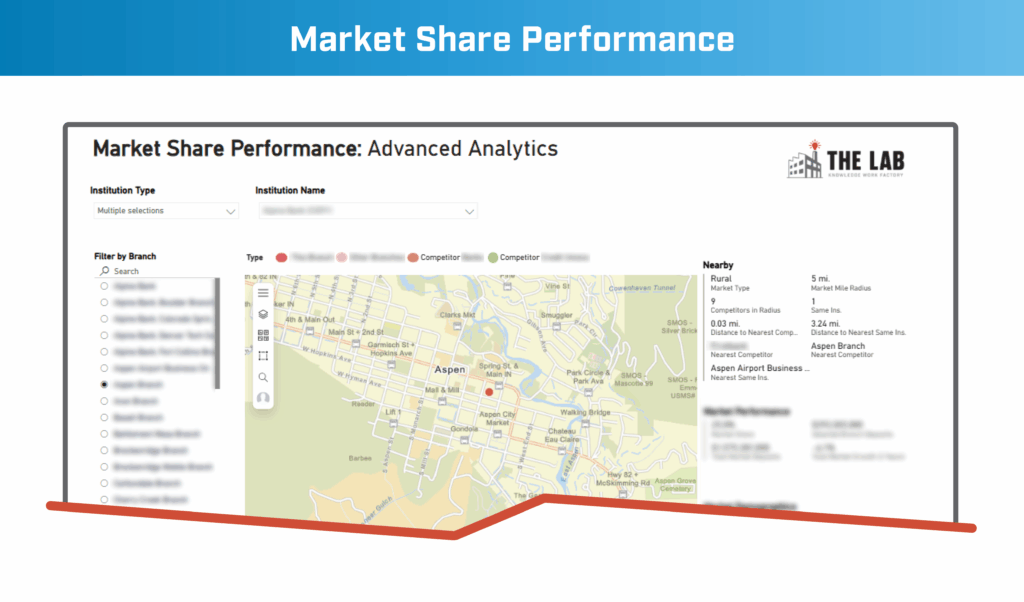
1. Insurance product performance navigator for market share. The Lab created this “navigator” to help your insurance carrier, brokerage, or agency to pinpoint which products to cross-sell/up-sell to the policyholders identified by the other navigators detailed below. This navigator specifically:
- Highlights the top competitive opportunities
- Delivers data on current market share, as well as growth of market share
2. Insurance navigator for profit. This navigator from The Lab delivers automated insights directly. For example, “The top nine percent of products are driving more than 86 percent of net margin.” This navigator specifically :
- Assigns letter grades (A through F) for profitability
- Calculates margin by policy
- Aggregates by policyholder, by product/service/line, etc.
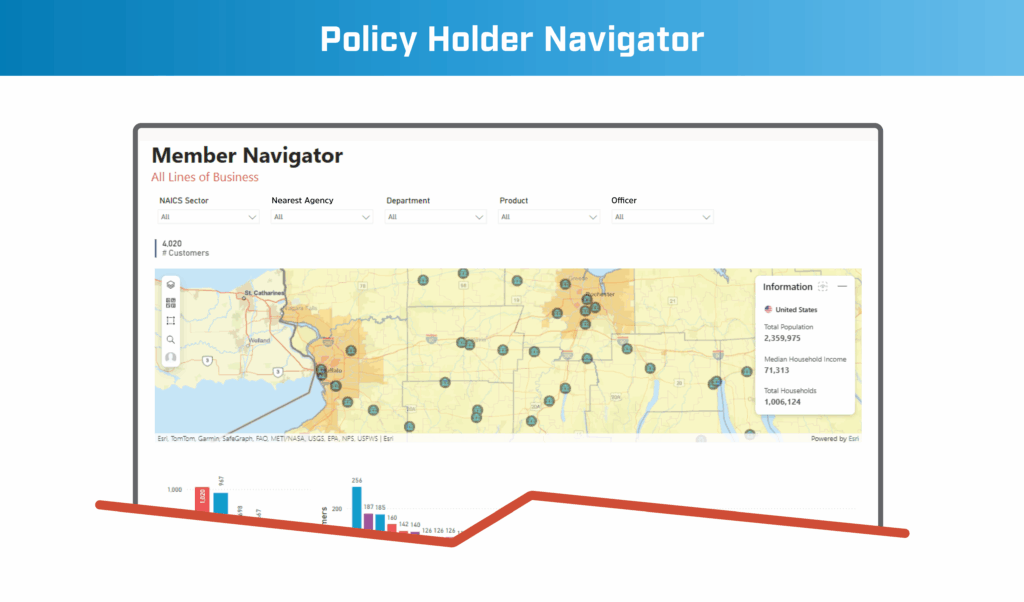
3. Insurance policyholder navigator. This navigator from The Lab serves up deep insights, such as “The top 11% of policyholders account for more than 91% of net margin.” This navigator specifically:
- Identifies cross-tell targets
- Segments policyholders by firmographics and demographics
- Segments policyholders geographically, with overlays atop actual maps
- Creates contact lists that are ready to deliver to your Sales and Marketing functions
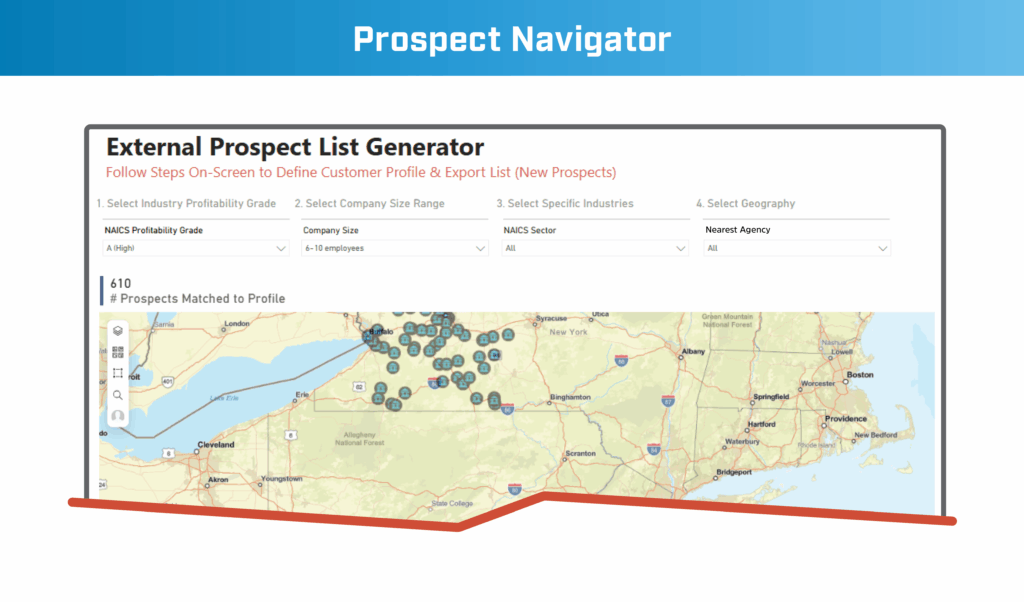
4. Insurance navigator for prospects. This insurance navigator from The Lab lets you reach beyond your current policyholder base. For all-new prospects, this navigator specifically:
- Identifies prospects who fit the identified demographic, firmographic, and even geographic criteria
- Outputs sales- and marketing-ready contact lists
Insurance Data Capability 3: “Vital few” KPIs for executives
Did you know there are only a limited number of top KPIs for insurance?
The popular Insurance KPI Handbook from The Lab contains more than 300 industry-specific key performance indicator metrics. Organized into seven major groups (including volume, quality, service, cost, revenue, productivity, and organizational), they span everything from to prospect-to-quote, to quote-to-bind, claims processing, and more.
The full list of KPIs is useful for everyone including managers. But for the “executive summary” audience—that is, C-suite executives in insurance—The Lab also offers our popular Executive KPIs for Insurance, containing the “vital few” which provide an “MRI” of the business at a glance.
To help make sure that top insurance leadership receives the right info, at the right time, the top two levels of performance insights from the analytics tool are fully automated, and served up directly to executives.
For example, let’s say that one of the metrics dips below the proper level, for a pre-determined “triggering” time period. Once it does, the remedial-action recommendations are sent to senior insurance leaders automatically. This “bot” will:
- Locate where the variance originates:
- Policyholders
- Employees
- Products
- Branches
- Pinpoint the root cause(s):
- Mis-priced quotes/deals
- Variable follow-ups
- Poor prospect quality
- Failures and/or delays in the process
- Preemptively head off issues in the future:
- Update applicable premium/pricing standards
- Automate follow-up of key activities
- Codify rules for prospect prioritization
- Reduce the bottlenecks in document collection
Executive KPI insurance dashboards from The Lab include best-practice improvements and actions for leadership to use with their front-line management; these improvements are also sent, automatically, to leadership. This lets them spend their time on seeing how issues get resolved—and not getting caught up in management disputes over the accuracy of the data.
Want to watch a 3.5-minute video of all this insurance horsepower as it plays out in the real world? Check out The Lab’s video showing Insurance Brokerage, MGA/MGU and Carrier Automated Data Standardization and AI.
How do you create an Executive KPI in insurance?
Here is the eight-step process:
- Review all existing executive-level insurance reporting
- Establish the top-layer Executive Score Card
- Review the portal design and structure for the insurance Executive KPIs
- Populate the data for selected KPIs—first pass only
- Publish the above “first pass” for executive user acceptance testing
- Incorporate the input gathered from the user acceptance testing or UAT
- Populate the data in the remaining insurance Executive KPIs, including drill-downs
- Complete and hand off all user guides and associated documentation
Insurance Data Capability 4: KPIs for managers
How to create the manager-level KPIs in insurance
Just as The Lab has curated insurance Executive KPIs, we’ve also assembled a collection of KPI dashboards for use across the different functions within an insurance carrier, brokerage, or agency. Each of these advanced analytics tools features about a half dozen KPIs to help your managers to measure and monitor quality, productivity, costs, and service.
And insurance executives aren’t the only ones who get insights served up to them automatically. Thanks to The Lab, the insurance Manager KPIs deliver actionable insights to the right audience, with triggers and thresholds pre-determined and automated in response to real-time KPI movement.
Each analytic dashboard in the suite has 2 goals:
- First, it shines a spotlight on actual insurance business performance, e.g., actual metrics for quote-to-bind cycle times, and various stage-gates therein.
- Second, it compares (or contrasts) as-is KPIs, at both the employee and product/service level, against SLA targets or service-level agreements. It then doubles as a proxy for policyholder experience.
Any gaps or inconsistent performance is highlighted directly in the dashboard.
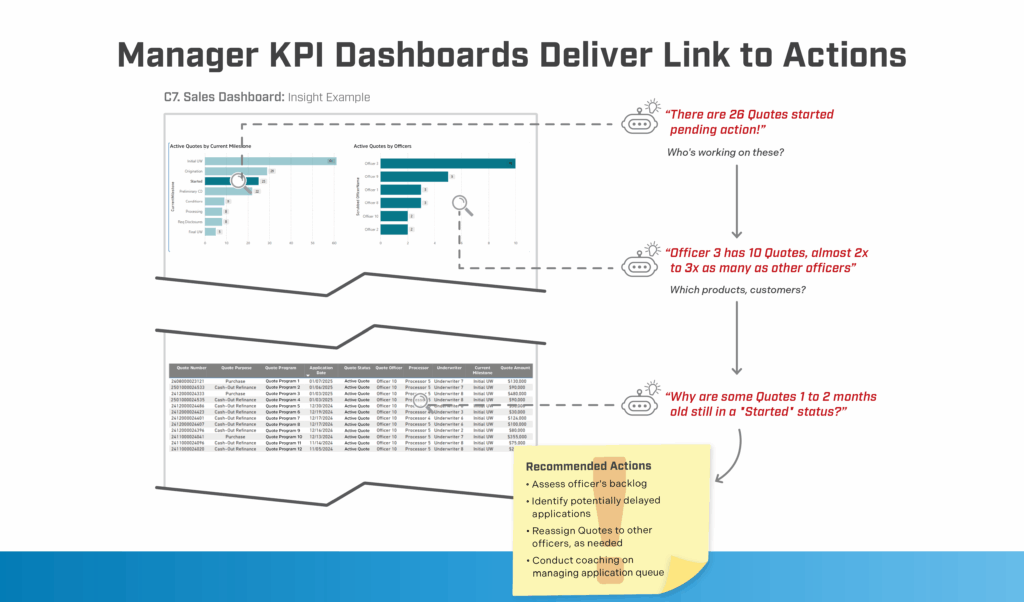
In the Quote-to-Bind dashboard shown in the image below, for example, we can see three different automatically-served insights:
- First insurance KPI insight. In the illustration, we can see that 25 different quotes have been “initiated.” Yet these same 25 are all waiting on required actions before they can reach the subsequent stage-gate… begging the question: “Who is working on these insurance quotes?”
- Second insurance KPI insight. Answering the previous question (“Who is working on these insurance quotes?), we see Insight 2: Agent 6 is working on 4x to 5x more quotes than her peers. This begs yet another question: “How does this pattern manifest itself at the product/service, and policyholder level?”
- Third insurance KPI insight. When we answer Question 2 (“How does this pattern manifest itself at the product/service, and policyholder level?”), we can see—startlingly—that there are quotes characterized as “initiated,” yet effectively gathering dust for 2 to 3 months.
Insights are followed by action recommendations:
- Scour Agent 6’s backlog.
- Identify all delayed quotes.
- Re-assign quoting activities to other agents as required.
- Conduct coaching for quote-queue management.
See it in action: Watch The Lab’s three-minute video detailing “P&C Insurance Claims Leakage Reduction Using AI, Advanced Analytics, and Business Intelligence.”
The complete 8-step process for creating Insurance Manager KPIs
- Review (after accessing) all existing insurance-management reports
- Create the design template for the Insurance Manager KPIs dashboard
- Get buy-in/consensus on the dashboard’s design and use case
- Connect the initial dashboard to live data source(s) from your different insurance systems, platforms, data lake, etc.
- Publish the Insurance Manager KPIs dashboard for UAT (user acceptance testing) by actual managers in your insurance organization
- Incorporate the input you’ve gathered from the above UAT trial session
- Publish the Insurance Manager KPIs dashboard
- Finish and distribute all user guides and documentation
Use Existing Investments In Tech (Part 2)
Why would my insurance brokerage, carrier, or agency need The Lab’s data model, if we already have a data warehouse?
If you’ve read this far in this article, this is certainly a logical question to ask. Indeed, there’s no shortage of data lakes and data warehouses among insurance carriers, brokerages, MGAs, and MGUs.
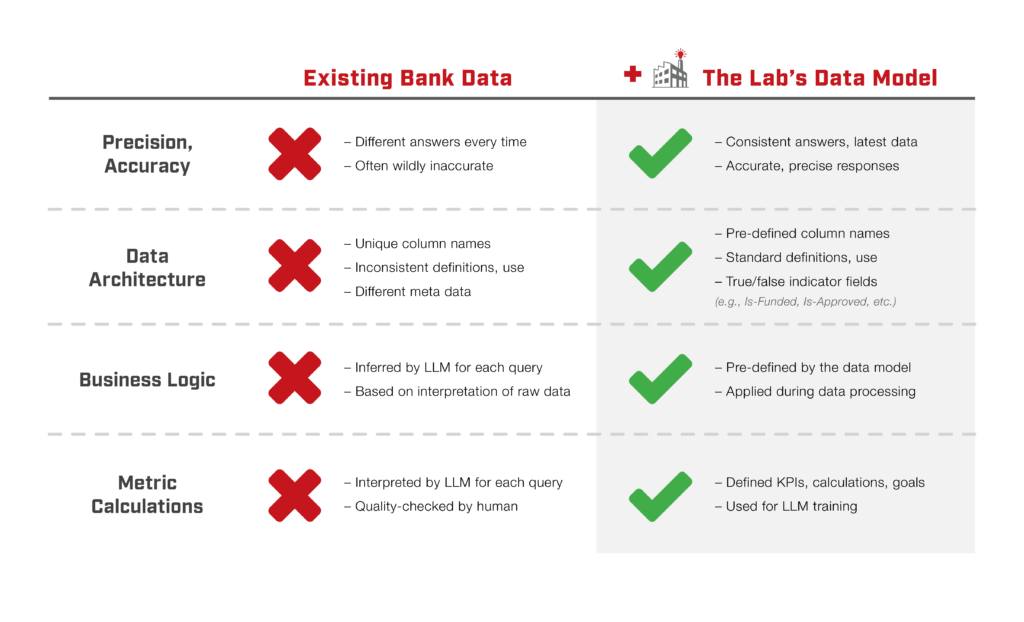
But the problem is the state of readiness. Sure, most insurance businesses focus—correctly, we might add—on centralizing all of their data.
But that’s only the first step. And that’s where most of them stop. The essential second step is standardizing all of that now-centralized data. That’s the prerequisite for data-driven performance in your insurance organization.
The Lab’s data model is effectively “data-lake agnostic.” It works with any existing data repository, standardizing it via ETL (extract, transform, load) into your now-usable/now-powerful data repository, thus unlocking all of the capabilities of data in insurance we’ve been detailing in this article.
What if you don’t have a data lake in insurance? Not to worry: The Lab’s data model will work for you, too; it will simply pull in your data from your different sources instead of a data lake.
Once your data has been standardized by The Lab’s data model, it’s ready for any pivots, derivatives, cuts, or combinations you’d care to throw at it. And it’s set up so that both humans and digital workers (i.e., automations) can interpret and work with the data quickly and easily, since the data is defined and integrated for both “audiences.”
Remember the old software acronym “GIGO”? It stands for “garbage in, garbage out.” The same holds true here, but in reverse: With good data to start with, you get excellent output, too.
 What are the 8 steps for integrating The Lab’s data model in insurance?
Here are the steps, in order:
- Create standard data tables on the insurance data network
- Set up the prioritized plan and schedule for data mapping
- Build all of the required data-loading processes, as needed
- Load all of your insurance data—from the actual systems or from your data warehouse—to standard tables
- Standardize all insurance product categories
- Standardize all insurance cost-center and department categories
- Standardize all agency/brokerage branch categories
- Hand-off the insurance data model and documentation
The Lab's Insurance templates
Where can insurance brokerages, carriers, MGAs, and MGUs get templates for integrating this data model?
The Lab has templates to help your insurance business integrate this data model; they’re straightforward and easy to use. Just map the templates to your sources: repositories and/or system data.
But who should do that mapping? At The Lab, we recommend that insurance carriers, brokerages, and agencies should use business analysts you already have on your team. After all, they understand the KPIs as well as the data. So they can quickly map it to the data model, defining and refining it as they go.
The Lab’s Insurance Resources
How can insurance businesses integrate the data if their teams are already flat-out?
We understand just how high-pressure your insurance brokerage, carrier, or agency operation can be. You’ve only got so many resources.
In which case, you can simply turn to The Lab. Not to boast, but we can typically perform this integration about 4x faster than your own analysts could. Our data scientists excel in both business and process expertise—and they do this every day—so they’re incredibly well-equipped to refine, define, and then map your insurance business’ data to our data model.
What, then, will The Lab do for you in a situation like this? A lot: We’ll run the project, locating every data source, no matter how deep it’s buried, and map it as needed. We even share teaching methods with your teams, which we’ve used and proven across countless organizations and engagements.
Benefit Types
What are the Top 3 benefits of standardizing insurance operations data?
Insurance agencies, brokerages, and carriers alike are able to reap direct cost-reduction/revenue-lift benefits from implementing a targeted data-standardization initiative:
- The market-analytics/policyholder toolset concentrates on margin and revenue.
- The Insurance Executive and Manager KPIs concentrate on cost reduction.
Indeed, insurance C-suite executives who include data standardization in their strategic-transformation roadmaps typically get benefits such as:
- Earn 2 – 5 additional margin points on every new sale
- Get a performance increase of 2x or more
- Align capacity—with a reduction of 20% – 35% across your branch network
Plus as we’d noted at the outset of this article, there are other benefits:
- Align capacity to actual work; automate the rest
- Improve policyholder experience & service
There are also “beneath the surface” benefits of both time and resources:
- No more urgent requests for ad-hoc performance reports from your team
- No more time spent (wasted?) on their creation
- No more questioning (okay, “arguing”) over the accuracy of the underlying data
Think about it: Getting unquestionably accurate at-your-fingertips answers to your performance questions alone gives you a return of 2 to 4x of your investment in insurance data standardization. And the peace of mind that comes from a true single source of truth is certainly invaluable.
Contact The Lab
How can an insurance business get started standardizing its data with The Lab?
The Lab has been working with executive sponsors at insurance brokerages, carriers, MGAs, MGUs, and other agencies for more than three decades. We’ve helped them to standardize their data to deliver business benefits and revenue lift; we can help you, too.
Our work with insurance business-unit and technology leads, as well as internal operational-excellence teams has helped them transform their insurance processes—indeed, their entire businesses. This paves the way for measurable results, and effective large-scale transformations.
Only The Lab has our Knowledge Base, built upon more than three decades of client-engagement IP, all template-ized and rapidly deployable for your insurance business. Our proven services and solutions—including our patented Knowledge Work Transformation™ delivery methodology—can empower your business-wide transformation, typically in just 6 – 12 months.
If you’re ready to transform your insurance data—and your business—book your screen-sharing demo with the friendly experts from The Lab. We never outsource or offshore; all of our expertise resides right in our Houston headquarters. Call (201) 526-1200 or email info@thelabconsulting.com to book your demo today.