














Data Standardization for Retailers: Keys to AI, Automation, and Advanced KPI Analytics
Talk to your retail data in real time, and have it answer you with performance-lifting insights:
- Increase retail performance 2x – 5x
- Gain 2+ to 5+ margin points on additional sales
- Align capacity with retail footprint
Your retail business, whether it is a chain of brick-and-mortars or a totally digital storefront, sits on top of a large volume of data. This data comes from your point-of-sale or POS system, your inventory management or IMS system, e-commerce platform, customer relationship management or CRM platform, and many more.
As a retail executive, business unit or technology lead, or part of an internal improvement team, you know that that data exists. You may well have centralized it into a common repository, “warehouse,” or “lake.”
But centralizing your retail data is not the same as standardizing it for automation and AI. Imagine, for just a moment (before diving into the rest of this article from The Lab), that your retail data is standardized to that level. You could, right this minute:
- Converse with your retail data. You can ask it questions, and get real-time, accurate, actionable answers.
- Leave the days of tasking others with “running reports” (not to mention “analyzing” and “explaining” them), happily in the rear-view mirror.
- Expand automation across more tasks, activities, and digital workers, with more reliable output than you have today.
- Get decision-empowering insights based on your own data, and not just not the general-purpose output of a public chat-bot.
If that matches your objectives, read on. Here at The Lab, we have created pre-built, templatized models for standardizing your retail data to deliver the kinds of benefits we just described. We have also created advanced data intelligence dashboards, AI, automation, and both Executive and Management KPIs to help you realize performance increases ranging from 2x to 5x.
Executive KPISs, Manager KPIs, Market and Customer intelligence, and Footprint intelligence
What Are The Top 4 Proficiencies You Can Get From Standardized Retail Data, AI, and Analytics?
Once you standardize your retail data (spanning all processes from procurement to inventory management, merchandising, store operations, sales, checkout, fulfillment, delivery, and post-purchase service) you will gain the following proficiencies for your retail enterprise:
- Retail Executive KPIs: These top-level metrics give you a high-level view of your retail business’ health, with each Retail Executive KPI is also drill-able for detail.
- Retail Manager KPIs: These are the deeper-level KPIs which inform and guide your frontline managers in their daily operations. In addition, when created by The Lab they include not only insights, but suggested KPI-triggered actions delivered automatically.
- Retail Market and Customer Data Intelligence: See actual behaviors and trends among your customers and markets. These insights support gains in conversion rates, retention, and sell-through rates, among other metrics.
- Retail Footprint Data Intelligence: See performance within and across your retail storefronts, whether physical, digital, or “phygital.” Compare locations. Find top performers. Identify laggards and solutions to their issues. Increase productivity and operating leverage across the entire network.
This executive “explainer” from The Lab will teach you more about each of the four above-mentioned retail proficiencies which you can gain via retail data standardization. It is all made possible by The Lab’s Standard Data Model.
And just in case you are concerned that you may have over-invested in your retail data lake and now will need an all-new one to implement The Lab’s Standard Data Model is designed to interface and work with your existing retail data lake or retail data warehouse. It will still be valuable to you; you will not need to invest in a new one.
What if you do not have a retail data lake or retail data warehouse? Will you now need to invest in one? No, The Lab’s Standard Data Model will work with your different, non-centralized data sources directly. We do not want to say that it is exactly plug-and-play, but you get the idea.
To see The Lab’s Standard Data Model in action, check out this video we created, which features retail insights in the world of banking. In the video, we provided before-and-after comparisons of typical GPT-powered chat agents, trying to get answers from the internet… vs. The Lab’s semantic Standard Data Model-powered chat agents (using MS Copilot) which use the clients’ actual data, combined with relevant external data, to deliver not only insights but suggested course corrections as needed.
If that video is a useful preview of how to standardize retail data to increase operating leverage, read on: We are going to provide more detail on each of the four data-powered proficiencies we listed above.
Discover the “vital few” KPIs for retail C-suite leaders
Data Standardization Proficiency 1: Retail Executive KPIs
The Lab has identified hundreds of KPIs, including formulas and definitions, for multiple industries, available as handbooks on our website. (Here is a sample with 500 KPIs for distributors, for example.) As a retail executive, however, you want top-level KPIs, dashboards, and tools. But you also want the management-level details to “trickle down” to the proper tiers.
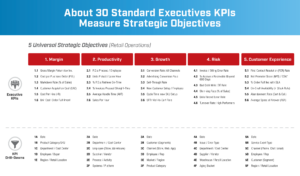
The Lab’s Executive KPI dashboards for retail leaders do both. To make sure that managers get the highlights and guidance they need, the two uppermost levels of the dashboard are designed to serve up automated insights.
For example, if a given KPI falls short of a pre-defined threshold, the automated actions will be triggered. The automation will guide retail performance by:
Each insight is paired with a recommended action. Each one is linked to a proven best practice improvement which is clickable for executives and leaders alike. This eliminates research and/or guesswork, concentrating effort on established best practice process improvement. because the data is consistent and traceable, decisions move faster and internal debate is reduced.
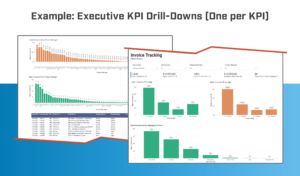
If you would like to view a brief demo of this power at work in the field of banking, check out The Lab’s Bank & Credit Union Advanced Analytics: Executive KPIs Scorecard YouTube video.
A step-by-step guide for creating a Retail Executive KPI
- Study your executive-level retail reports
- Establish the top-level scorecard
- Design the portal for the Retail Executive KPI
- Load in the initial data
- Push out the prototype for executive testing
- Revise, per executive testing feedback
- Load in the next Retail Executive KPIs and click-downs
- Publish
- Distribute user guides and documentation
How to create data KPIs for retail managers to improve performance
Data Standardization Proficiency 2: Retail Manager KPIs
Now that you have read about Retail Executive KPIs, you can likely anticipate how The Lab approaches Retail Manager KPIs. We create the proper dashboards for those that focus on quality, productiveness, retail service, and cost.
Just like Executive KPIs, these Retail Manager KPIs have time and/or KPI performance-based triggers for automations which serve up suggested actions to take.
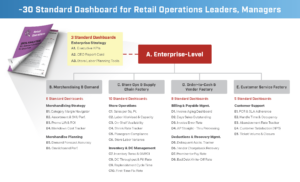
Each data analytics dashboard performs two overarching functions:
- It provides deep visibility into retail business functions, with KPIs spanning activities such as sourcing and vendor evaluation; warehousing and storage; inventory allocation; payment processing; and more.
- It shows how those KPIs, at the product level and/or employee level, stack up against pre-set targets creating a visible proxy for retail customer experience.
Variance and lapses are called out; in the image below of a retail Purchasing management dashboard, the following cascading insights become apparent, and are served up automatically to managers:
- First Retail Management Insight: As you can see in this example, 130 different purchase orders have been “created,” yet they have stalled. Naturally, you would want to know: “Who is responsible for processing these purchase orders?”
- Second Retail Management Insight: Answering the above question, we can see that Purchasing Agent 26 is saddled with 2x the workload of her peers. We would then want to know: “How do these shake out between different suppliers, product categories, and warehouse locations?”
- Third Retail Management Insight: When we dive into answering the above question, we can now see that some purchase orders have been “gathering dust” for eight to 12 weeks.
At this point, the analytics “bot” delivers recommendations of specific remedial actions, such as:
- Scouring Purchasing Agent 26’s backlog of P.O’s.
- Finding any P.O.’s which have been delayed.
- Shifting some of the P.O. burden to other purchasing agents in the department.
- Implementing coaching for P.O. queue management.
Watch an automated dashboard at work. In the field of banking, see how The Lab created an advanced analytics dashboard with automated insights/corrective actions, covering Commercial Lending Sales Pipeline Management. Check out this brief (4-minute) YouTube video.
How to create Retail Manager KPIs:
- Evaluate current retail management reports
- Create a demo of the dashboard design; get sign-off
- Plug the dashboard into live source data
- Publish retail management dashboard for users to test and review
- Fold in the above feedback
- Publish dashboard
- Push out documentation
Take advantage of “navigators” to elevate sales and margin, and expand markets
Data Standardization Proficiency 3: Retail Market and Customer Data Intelligence
You know that retail operations are all about good data. Now think of what your business would be like with great data, amid retail challenges ranging from inflation and spiraling operational costs, omnichannel inventory management, and supply-chain volatility. Imagine knowing, whenever you ask:
- Which SKUs and categories are driving the most profits
- Which customers are the most profitable
- Where you can find those specific customers
- How to improve up-selling and cross-sales
- More
These retail capabilities are available to you through the following “navigators” available from The Lab.
See a “cross-sell generator” at work. Watch a four-minute demo of The Lab’s Product/Customer Profitability & Cross-Sell List Generator. It’s shown here for retail banking but applies just as easily to pure-play retail. Check out the video.
1. Retail Profit Navigator: Find out, instantly, insights like “The top 8% of SKUs are responsible for north of 41% of net margin.” The Retail Profit Navigator
- Calculates margin by product, SKU, category, etc.
- Aggregates by customer, product, and so on.
- Generates “A” through “F” profitability scores
2. Retail Customer Navigator: “The top 6% percent of our customers are responsible for more than 37% of net margin.” The Retail Customer Navigator…
- Helps to segment customers by demography and geography, complete with graphical mapping
- Pinpoints up-sell/cross-tell targets
- Generates contact lists for sales and marketing
3. Retail Prospect Navigator: To expand your retail reach beyond your existing customers, put this navigator to work, because it
- Finds the prospects who fit your pre-defined demography/geography criteria
- Outputs sales- and marketing-ready lists of contacts
4. Retail Market Share Performance Navigator: This “navigator” from The Lab will enables your retail enterprise to drill down to the specific products that are best for upsell/cross-sell to the prospects and customers surfaced by the other navigators. The Retail Market Share Performance Navigator
- Delivers the latest market-share information, including market-share growth
- Identifies the leading competitive retail opportunities worth exploring
Make the most of your retail network with AI and automatically served insights
Data Standardization Proficiency 4: Retail Footprint Data Intelligence
Despite your best efforts at retail uniformity and brand consistency, you know how many things appear to differ in the field, from location to location:
- A store manager, for example, in downtown Los Angeles will want to run the location “his way.”
- Yet just a few miles west, in Santa Monica, another store manager will believe that that location requires a wholly different approach to operations.
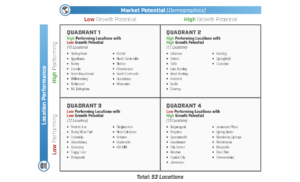
Who is right? Data-informed answers are available? With Retail Footprint Data Intelligence from The Lab, you will have Reliable information you can use to improve the performance of every retail storefront in your enterprise, and the branch network as a whole.
Consider these four Retail Footprint Data Intelligence analytics tools available from The Lab:
See retail branch staffing model/cost reduction analytics at work. Simply check out this 3.5-minute demo video.
Centralizing data is only step one; standardizing it is where the value comes from
My Retail Enterprise Has Its Own Data Warehouse. How Can The Lab’s Data Model Add Value?
There are plenty of retail enterprises out there which have already invested in a data lake, warehouse, or similar central repository. Centralization is a necessary first step, but only a first step.
The second step is arguably more important: That is the standardization of all that centralized retail data, from the POS, CRM, e-commerce platform, HRIS, and so on.
The idea of tying all this data together is never even considered by many retail leaders who are missing out on the benefits of data-driven performance in their businesses.
So, if you already have a data lake in your retail business (and even if you do not), you can get substantial value from The Lab’s data model. It plugs right into your existing data (lake, warehouse, or individual sources). Then it normalizes your data, from all those sources, into one usable, powerful repository that you can then easily tap into to get all the benefits we have described above.
Once your data has been organized and standardized into this single source of truth, you can put it to work: Cut it, pivot it, create derivatives and combinations. Since the data will be standardized for human and digital workers alike, both will be able to interpret and use it quicker and more effectively.
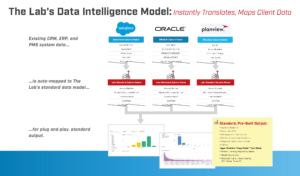
It is the opposite of GIGO or “garbage in, garbage out.” This is reliable data in, reliable data out.
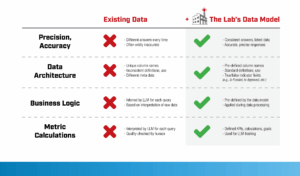
Load steps, staffing, and optional implementation support from The Lab
How Do I Load The Lab’s Standard Data Model into My Retail Business?
Follow these steps:
- Establish the standardized data tables on your retail data network
- Map out the priority-based plan and schedule
- Create the loading processes for the data as required
- Load in the different sets of retail data, either from your different systems or your retail data warehouse, to the standardized data tables
- Be sure to standardize all retail product categories
- Similarly, be sure to standardize each category of retail department and cost center
- Standardize every category of markets and branches
- Push out the retail data model and its associated documentation
Who on our retail team should map the data to The Lab’s data model?
There is a good chance you can perform all the above activities in-house. Everything from The Lab, after all, has been templatized for rapid rollout and easy implementation. Use our templates. Map them to your data sources. And that is it.
Who, on your retail team, should be entrusted with this work? Ideally, they would be existing data analysts who understand both your data and your essential retail KPIs
such as sell-through rate, gross margin return on investment, customer retention rate, shrinkage rate, and more. They can thus wrangle the data from its different sources, refine it as needed, and map it to The Lab’s data model.
Many retail leaders assume that these tasks should fall to their IT department. We disagree. They lack the business and analysis skills which your analysts already possess. Plus, they have their plates full keeping the lights on. So, tap their unique expertise at the final mile, making sure that all the connections are properly configured.
Our retail operation lacks the capacity to integrate the data model. Can The Lab help?
Even with the ease-of-use of The Lab’s templates, some retail businesses still lack the internal resources to implement our data model. The Lab can help. Nothing against your internal analysts, but we can likely map the data, implement the data model, and make all the connections about 4x faster than they could. After all, our data scientists possess the business and process expertise and experience needed to rapidly map your data to The Lab’s model.
If you opt for our help, you will get full support. We will run the project. We will track down every data source. We will map each data stream. And we will even supply your teams with proven teaching methods that we have employed and honed over the course of thousands of organizations and engagements.
Quantifiable ROI in cost, margin, capacity, and executive decision speed
What Are The Performance Improvements Available From Standardizing Retail Data?
In the highly competitive retail environment, data standardization is an initiative which delivers quantifiable ROI. The retailers that standardize data are able to reduce costs (via Executive and Manager KPIs) and increase revenue (via market-analytics toolsets). Indeed, the results we typically see, when data standardization is rolled into a wider retail transformation initiative, include:
- Performance increase of 2x to 5x
- An additional 2 to 5 margin points on new sales
- Capacity alignment and reduction of 20%- 35% across the retail branch network
Standardized data also eliminates several recurring drains on your retail team’s time:
- You will not be asking for drop-everything ad-hoc reports.
- You will not be wasting the resources of the people who must create those.
- You will not be wasting time arguing over the validity of any given report.
Getting instant, reliable answers to your questions, as a retail executive, will help you realize a 2x – 4x ROI on your data-standardization effort. And what about the ability to have your data at your fingertips, which you can chat with at any time? That is invaluable.
30-plus years of experience, our Knowledge Base, and the Knowledge Work
How Can The Lab Help Me to Standardize My Retail Data?
The Lab has been helping C-suite executives, business-unit and technology leaders, and internal improvement teams with data standardization for more than 30 years. We can help your retail business, too. The Lab helps you to transform your retail business and its processes to deliver quantifiable benefits as part of a large-scale transformation effort.
Our industry-proven solutions and services, backed by our Knowledge Base of more than 30 years’ worth of templatized client-engagement IP, combined with our patented Knowledge Work Transformation™ methodology, can help to transform your retail enterprise just six to 12 months.
Are you ready to transform your retail data and your retail business? To schedule your screen-share demo with our Houston-based experts, just call (201) 526-1200 or email info@thelabconsulting.com today.