Case-study learnings for everything from back-office and branch efficiency to advanced analytics and robotic process automation
Regional and mid-sized banks have unique competitive challenges. They simply lack the mega resources of the huge national banks, so they can’t outdo those competitors when it comes to things like volumes of ATMs or developing, and updating, the latest mobile app.
In other words, these banks—and if you’re reading this, you’ll know—must differentiate themselves in the realm of commercial loans, sourced and written locally. They must also rise to best-practice performance in areas like deposit, loan, and call-center operations. As a trend, these are all moving from branches to centralized back offices.
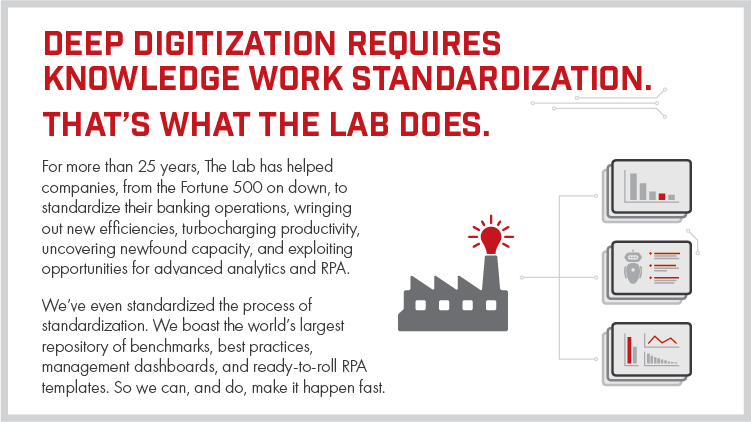
What these challenges have in common is standardization. Standardization in banking is defined as the implementation of uniform process and operational data throughout unique business units in banks. Not only must every process activity be performed flawlessly, but it must be performed consistently—from function to function, from branch to branch, from employee to employee, from keystroke to keystroke.
Interested in a deep dive into the history and benefits of standardization? Be sure to read this explainer on standardization.
Standardization applies to data, too. You can’t expect to increase branch profitability, improve your efficiency ratio, or introduce powerful new technology such as advanced analytics or robotic process automation if your data isn’t standardized and uniform.
This case study is actually a mashup of several, for several reasons. First, it spans numerous operations familiar to regional and mid-sized banks, so you’ll certainly find parts of the story that apply to your bank. Second, it encompasses stories from banks that have chosen to grow by acquisition, as well as those that favor organic growth—yet both share the common challenge of standardizing their centralized back offices. Finally, combining several stories into one helps us to keep the players anonymous. That said, you can certainly learn from their experiences!
Banking analytics and operational measures in the crosshairs
It will come as no surprise that the banks in this case study all wanted to grow, and do so profitably. Drilling down into their goals, however, we can find many components to this growth, all of which depend upon the ability to standardize process and data. They include:
- Growing assets.
- Curbing expense growth.
- Increasing branch profitability.
- Performing per-branch profitability analysis.
- Analyzing and optimizing their product portfolio.
- Reducing their efficiency ratio.
- Achieving scale in the back office.
- Harnessing operational data so it could be visualized into decision-aiding strategic dashboards.
- Improving individual worker efficiency.
- Finding the most valuable use-cases for robotic process automation (RPA) and implementing it.
When these banks came to The Lab, there were things they knew too well—as well as things they wanted to find out.
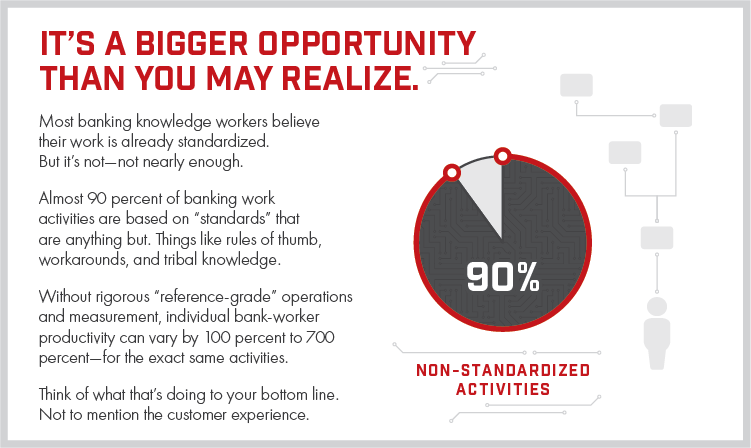
They knew they needed help. Certainly, they could calculate their own efficiency ratios. Some of them did benchmarking, which revealed that they were lagging behind their peers. They could see their personnel expenses ballooning; they could even see that some of their employees, with identical titles, were performing disparate roles—and getting paid widely-differing amounts.
More tantalizing was what they couldn’t see. With unstandardized data, they couldn’t see what products were unprofitable. They couldn’t spot branch-to-branch, or worker-to-worker, variance. They couldn’t identify which aspects of the customer experience were suffering and could stand improvement. They didn’t know where to bolster training. They couldn’t even see a basic process, such as writing a commercial loan, from end-to-end, every single step of the way. That may sound impossible, but we’ve found it to be more the rule than the exception for banks of this size.
Drilling down to standardize the commercial loan process
Since these banks live or die by their commercial loans, this was a top priority in all of our assignments.
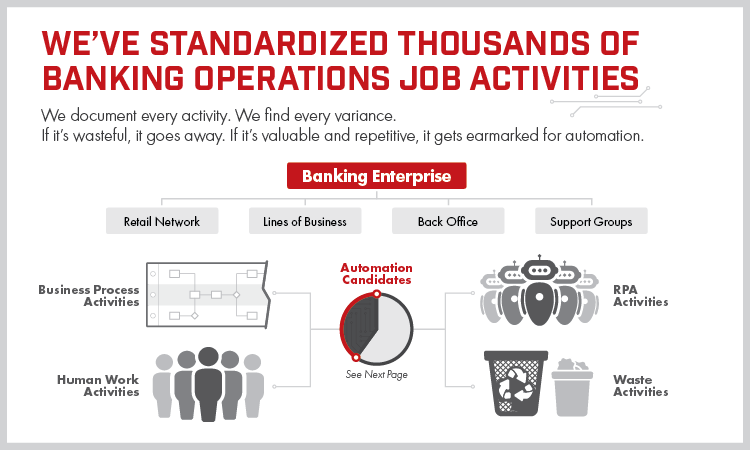
First, we needed to identify every step in the commercial-loan process, from end to end, down to the 2 minute work activity level. As we’d noted above, most banks simply haven’t done this. And it’s impossible to identify the variance if you don’t.


At The Lab, we take a grassroots front-line (vs. a top-down) approach. We get the employees themselves to document their daily, minute-by-minute (and even keystroke-by-keystroke) work activities. We do it via an engaging and eye-opening process we call a Map Fair. This is where the actual branch and back-office employees mark up a huge workflow printout. And we do mean “huge”: it’s as long as an office hallway wall. We’d conduct Map Fairs at the centralized back office; we’d also send out maps for markup to dispersed branches, for eventual return to the headquarters.
The results are as indisputable as they are arresting. We’ve worked with banks whose loan applications suffered anywhere from 60 to 80-percent NIGO (“not in good order”) ratios; that’s how often they were kicked back from Underwriting.
The Map Fairs—and our interpretation of the resulting data—revealed why. The war stories are innumerable; consider just a few examples:
- We’ve seen sales staff inputting loan-application data. Lots of it. These are highly-paid frontline, customer-facing staff… doing the work of lower-paid back-office data-entry people.
- We’ve seen underwriters inputting loan data, due either to expediency or frustration. The loan assistants are supposed to do this work, but many times, they don’t.
- We’ve seen salespeople who fail to communicate properly with borrowers up front—because the sales reps don’t know what to ask. This stalls the process, while infuriated underwriters kick back more NIGO applications—and more customers get frustrated by multiple requests for information, not to mention delays.
- We uncovered the performance record of one loan salesperson—let’s call her “Sandy”—who seemed to boast an incredible record-high level of sales. Who was this stellar performer? As it turns out, “Sandy” wasn’t even a sales rep. She was a loan assistant, who was initiating all the paperwork for ten different sales reps, who didn’t fill out the apps themselves, or log themselves as the salespeople in the system. How, then, can you analyze what you don’t know? (At least we were able to update that bank’s training for salespeople, with little computer-side “placemats” which reminded them to input the loan-app fields correctly.)
Operational data standardization opportunities
Why do some loans fail to consummate? You’d think that the root causes would be easy to identify, pointing up opportunities to shore up gaps.
But many times, it’s not so simple. The culprit is the quality of the data structure.
This isn’t just a matter of “inputting the fields correctly.” It’s more a matter of the fields themselves. In other words, it’s a data-structure challenge. As you’ve surely guessed, this is a bigger, and more fundamental challenge. But it’s worth the effort.
In the case of the mystery of the failed loan causes, we found that the bank’s database had a free-form field for loan processors to fill, in the event that a loan fell through. In reality, most loan failures were due to only a handful of common causes; these needed to be recoded as simple drop-down choices in the database. Only the rare outliers that didn’t fall into these categories could be assigned to an “Other…” drop-down choice, with a free-form field for clarifying explanation.
On the IT side, this isn’t terribly hard to execute. The real challenge goes back to the Map Fair fundamentals: Identifying and codifying each step of the process, so you can effectively inform the IT team of what needs to be updated.
Similarly, we’ve seen call-center data that was commensurately opaque. In one bank that fielded some 35,000 calls a month, fully 20 percent of the reasons for calls were listed as “Other.” That’s 7,000 calls! Again, we needed to guide IT to create new, appropriate drop-downs. We also needed to introduce some really simple training (again, “placemats”) to help call-center workers take advantage of the good pull-downs that already existed.
Making the move to”democratized” tech
You can’t read the news today without stumbling across a story about robotic process automation, artificial intelligence, or advanced data visualization and analytics. These technologies hold tremendous potential for regional and mid-sized banks—but they simply can’t be introduced or implemented without a foundation of standardized processes, work activities, and data.
But once you have that, watch out! The results are unbelievably empowering.
Business intelligence, or BI, can pull data from multiple sources simultaneously—we’re talking more than any analyst could ever cram into an Excel spreadsheet. Then it crunches that data and turns it into easy-to-understand visual dashboards that update daily, weekly, quarterly… however you like.
For example, we’ve helped banks to analyze every single transaction occurring in every single branch. With BI, it’s easy. And it lets you see things you’ve never seen before. We found, for one bank, that 25 percent of transactions were related to a low-profit product that was sapping workers’ productivity in both the branches and the back office. We identified “grandfathered” products with codes that were clogging the database and complicating analysis. We saw opportunities to simply tag products with basic categories—such as “Commercial,” “Small Business,” and “Retail”—in order to see where the profits were, or were hiding.
Good data helps banks drive big decisions. We could see, branch-by-branch, which ones leaned toward retail, vs. consumer. This affects staffing and training. We could also see every touch-point on the customer journey; this lets us help our banking clients to craft surveys that measure the right metrics. It lets them, in turn, standardize and improve the customer experience, aligning it with customer expectations.
Banking bots – the mundane and routine copy/paste work Terminator
Robotic process automation or RPA is red hot. And little wonder: It’s like an Excel macro that can span multiple applications. Once you’ve standardized your data, work activities, and mouse-clicks, it can run at light speed, freeing your knowledge workforce from drudgery and input errors. Some processes are already standardized enough for RPA; the trick is identifying the use-cases.
Learn more about robot process automation in banking by reading our long-form explainer on banking bots here
Here’s an example. For one bank, we found that customers making in-branch credit-card payments via check, needed to fill out a ticket to do so. Once they did, a back-office person would search out the customer’s name, account number, payment amount, and due date, and input that into the system to apply it to their card account. Due to the complex structure, it would require up to four different general-ledger entries to move the money from one part of the bank to the other.

Compounding the complexity: The tickets themselves weren’t standardized from branch-to-branch. This created a manifold increase in the back-office processors’ workload. This one use-case alone was costing the bank upward of 50 person-hours per month… per branch.
Three UiPath Banking Bot Video Examples Implemented by The Lab Consulting
Banking Robotic Process Automation Video Use Case and Case Study # 1 – ACH Stop Payment Processing
https://youtu.be/KrrLrxzPnEM
Banking Robotic Process Automation Video Use Case and Case Study # 2 – Debit Card Fraud Processing
https://www.youtube.com/watch?v=phh75Gjz-3Y
Banking Robotic Process Automation Video Use Case and Case Study # 3 – Regulation D Violation Letter Processing
https://www.youtube.com/watch?v=Lxive03vlIE
While standardizing the tickets, data, and activities could, and did, accelerate the process, it also paved the way for RPA. The implications were profound: This affected up to 75 staff positions, at a cost—make that “savings”—of nearly $4 million a year.
Standardize your banking operations now
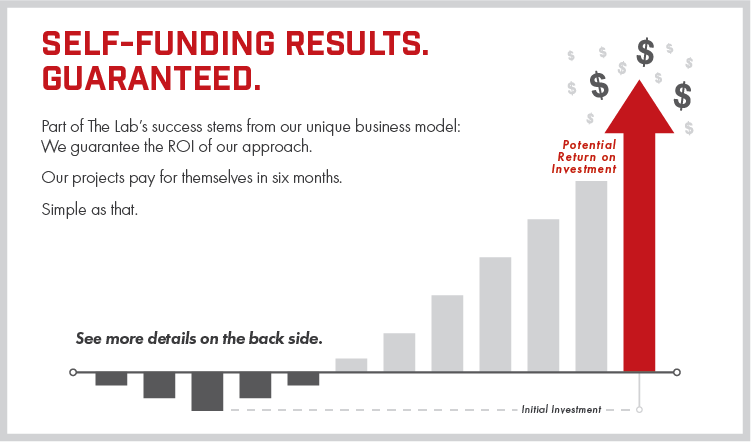
There’s no need to look longingly at these other banks’ successes. You can make the same strides, too. Impressively, the stories we’ve related above have shown results in as little as six weeks. Even more impressive: The Lab employs a unique engagement model, in which we guarantee that any expenditures on our efforts will self-fund—yes, pay for themselves—in just six months or less.
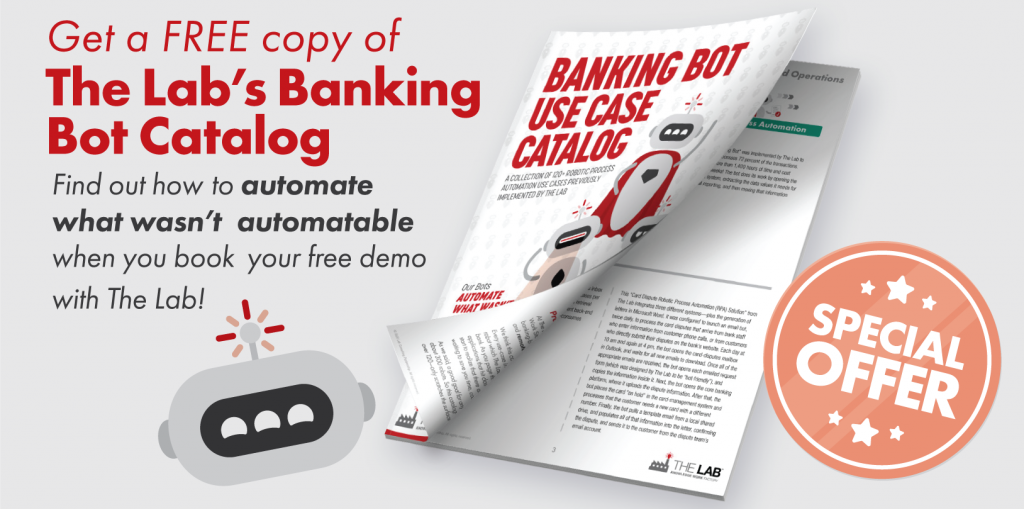
Learn more today. Contact The Lab at (201) 526-1200 or info@thelabconsulting.com to book a free, no-obligation 30-minute screen-sharing demo.
![]()
For 2021: We have updated our bank client offering. Much of these findings and implementation results can be reviewed in the 3-part-series of “Big Rocks for Banks” below. Find out how to strategically lower costs, increase operating leverage, improve customer experience, and automate what previously wasn’t automatable in your bank.
Find them all here: