


A guide for addressing the “perfect storm” of adverse market conditions confronting banks now—and preparing for a forever-changed, volatile future.
The banking industry is reeling amid an onslaught of challenges that include:
- Constant market shocks
- Endless employee turnover with no end in sight
- Ever increasing core system cost and capability constraints
- Fintech encroachment and customers demanding 100% automated and digital experiences
- Interest rates hikes impacting loan sales
- Unsustainable employee compensation increase expectations
It’s a volatility threat that requires managing revenue declines and cutting costs while simultaneously increasing operational effectiveness—especially operational flexibility. This disruption requires banking executives to immediately address three “big rocks” of operational efficiency:
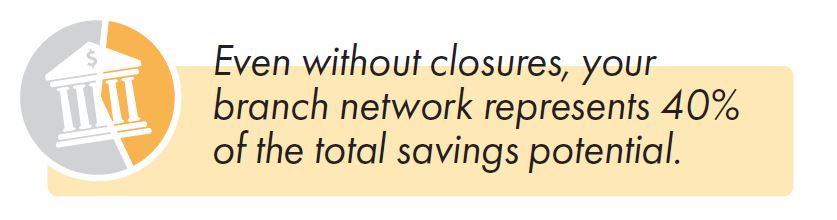
- Big Rock 1: Retail branch network. You need data-driven decision-making to stop over-serving markets and locations—without damaging customer perceptions. Even without closures, your branch network represents 40% of the total benefits potential.
- Big Rock 2: Lending—commercial and consumer. You already know that all sales producers are not created equal. But you don’t know how burdened underwriters, loan admin staff, and customers are by “NIGO” activities: “not in good order” rework and remediation. You need to eliminate these activities without impeding the performance of your revenue engine—while improving customer experience and revenue productivity. The next 35% of operational benefits potential—and the trickiest—lies here.
- Big Rock 3: Back-office operations. Turbocharge speed, efficiency, data accuracy, and regulatory compliance while dramatically reducing costs, forever, with robotic process automation or RPA. A quarter of all benefits reside here.
This article will address Big Rock 1: Operational efficiency in the retail branch network.
There’s no going back
While today’s economy will certainly recover, ways of doing business—and banking—will not. The lessons learned of the past 2 years are too powerful to ignore. These are the lessons of disruption and volatility.
Importantly, banking executives need organizations that deliver “operating leverage”: the capability to grow revenue much faster than costs—and, in a downturn, the flexibility to absorb large declines in revenue with minimal operational damage. The good news is that today’s confluence of disruptive events offers banking executives a rare opportunity to cut costs and volatility-proof their businesses against the inevitable shocks of the future—at the same time.
But this opportunity is fleeting. Action is required now. As Winston Churchill said, “Never let a crisis go to waste.”
The four keys to operational efficiency in retail bank branch networks

Cutting costs across-the-board in branch networks can be counterproductive. But strategically reducing over-service can deliver a competitive gain. This effort can be broken down into these steps:
- Know precisely what customer types are served by each branch, based on the deposits generated, the transactions being processed, and the products being purchased.
- Create predictive models to estimate losses/transfers of customers and deposits. Losing unprofitable customers to competitors is a valuable benefit, so ensure that Step 1 measures profitability at a granular level: customers, products, and sales producers.
- Change hours of operation based on demand—hours of transactions actually being processed—so staff aren’t idle and the network isn’t overstaffed.
- Create a retail staffing model with enterprise-, division-, and branch-level views, using in-branch transaction data.
All of this, clearly, affects branches slated to remain open. The “even bigger rocks” of branch consolidation and branch footprint reduction will be addressed later in this article.
Improving operations in retail branch networks: Efficient staffing
One of the first things a bank needs to do, when it’s looking to “bust the big rock” of the retail branch network, is study its data, re: branch transactions.
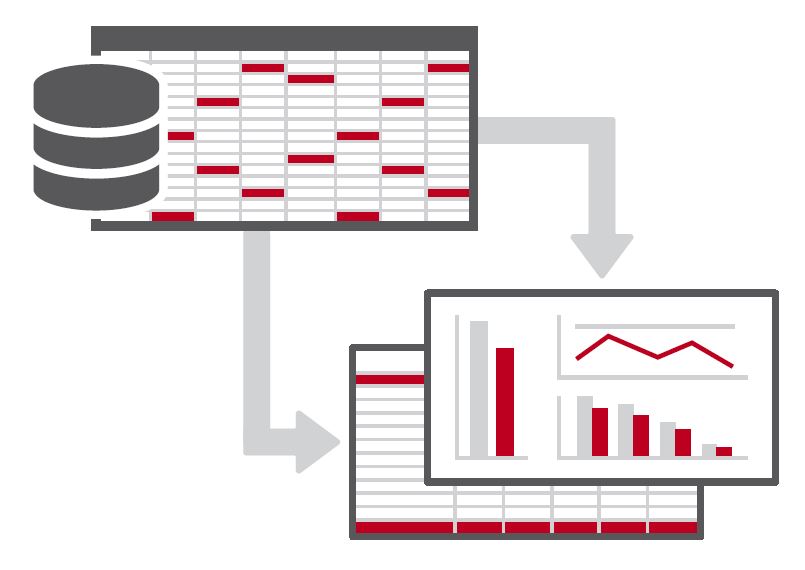
Surprisingly, most banks fail to do this. We know, because at The Lab, it’s often one of the first things we do. The banks will have the data, but they haven’t leveraged it—cleaning it, parsing it, creating useful KPIs based on business-relevant ratios, and then plugging it all into a business intelligence, or BI, platform that provides invaluable visualization.
The power of visualization cannot be over-stated. Executives can quickly see where value is generated and, more importantly, where it is squandered—usually with good intentions. The Lab calls this costly anomaly Virtuous Waste™.
(Helpful hint: Don’t wait for the IT shop to get around to addressing the critical business task of leveraging existing data from core systems. They’ve got their hands full with daily operations.)
So, you’ll want to find out what customer types are being served by each branch. Which are the most valuable? Which are the least valuable? Similarly, you’ll want to see which transaction types are taking place, on a branch-by-branch basis: where is the simple check-cashing taking place, vs. the more valuable commercial-loan and mortgage applications? Then you’ll want to dive down into even greater detail, to a day-by-day and even hour-by-hour analysis. You certainly don’t want staffers sitting around idly. You don’t even want a branch to be open if no one is visiting it during certain days or hours.
Armed with this information, especially if it’s visualized in predictive and prescriptive KPI analytics, you’ll be able to put forth a concise, straightforward proposition to fine-tune operating hours—and even move employees—on a branch-by-branch basis to meet forecast demand. Today, you need this capability in real-time—and it’s there. But it’s lurking below the surface noise that results from the friction between the need for in-house data transparency, IT’s operational culture, and the business lines’ unfamiliarity with the wealth of leverage-worthy data on hand.
Misperceptions in branch staffing
Today’s bank C-Suite is often torn between the pressures from the market, and the board, to cut costs—and internal voices that are clamoring for more staff.
The Lab can add some simplifying clarity to this conflict. We’ve seen banks where retail leaders claimed it was “irresponsible” to have, say, fewer than seven staffers in a given branch. Yet a simple analysis of the data revealed that these staffers were processing just two transactions per hour. It’s hard to justify the need for seven tellers—when they’re doing the work of just three. The key to making this change quickly is KPI data visualization.
Here’s another “big rock” in banking—one that’s so big, we could devote an entire article to it. And that’s the huge rock of reducing—ideally, eliminating—performance variance among individual employees performing identical tasks.
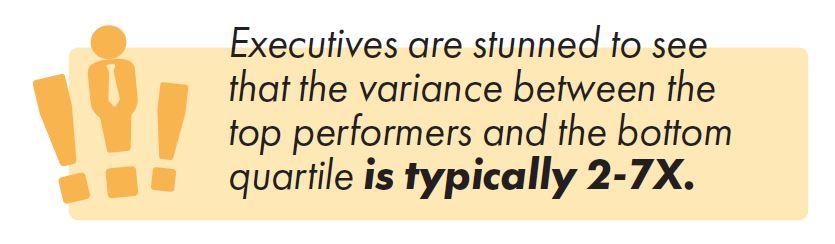
Most organizations use overall averages to measure employee performance. This lulls executives into perceiving that the employee-to-employee variance is probably negligible—perhaps in the 15- to 30-percent range. If this were true, it’s not worth the effort to investigate further. But it isn’t true. Executives are stunned to see that the variance is typically 2-7X between the top performers and the bottom quartile.
When this data is presented in a visualized format, it’s clear that the top performers shine…and that they get a raw deal. They are virtually unrecognized, while the bottom quartile do a fraction of the work and are allowed to be perceived as nearly equivalent in value to the business.
Applying market demographics to control cost in retail bank branches
So far, this article has focused largely on internal data available to banks: headcount, hours of operation, types of transactions processed. Yet it’s also possible to pull, overlay, and visualize external information, which provides banking executives with unprecedented decision-making effectiveness. The Lab performs this service routinely for banks of all stripes and sizes, truly leveling the playing field: We give them the type of information that you might think only the top three or four banks, nationally, can get their hands on. That’s not true.
Consider these intriguing details.
The “power” in advanced analytics platforms such as Microsoft Power BI lies in their ability to instantly crunch data from as many sources as you can throw at them—and then serve up the resulting insights in dashboards that allow seemingly infinite deep-dive options to paint an inarguable picture of the optimal bank-branch landscape. Often, no matter how many scenarios you attempt, the answer is obvious and inescapable. Interminable, organizational debate is ended.
And when we say “landscape,” we mean it quite literally. We’d mentioned “external data” above. This means, for example, U.S. census information, showing not just population and income levels, but trends in population growth—which areas are growing (or shrinking), and at what rates. It’s a godsend for projections. Imagine seeing, on an actual map, your branch network as it pertains to the area’s household income, disposable income, age group, population density, and trends. It’s almost like having a crystal ball. The Lab delivers this quickly and routinely.
The Lab also pulls data from the FDIC: They maintain data on every branch of every bank in the United States—and it’s public information, so we leverage it. Imagine that same map, described above, enriched with data on each of your local competitors’ branches. It might look something like this:

It gets better. We routinely pull data from D&B/Hoovers, to show all of the businesses in the area. Take a look at all the blue dots below:
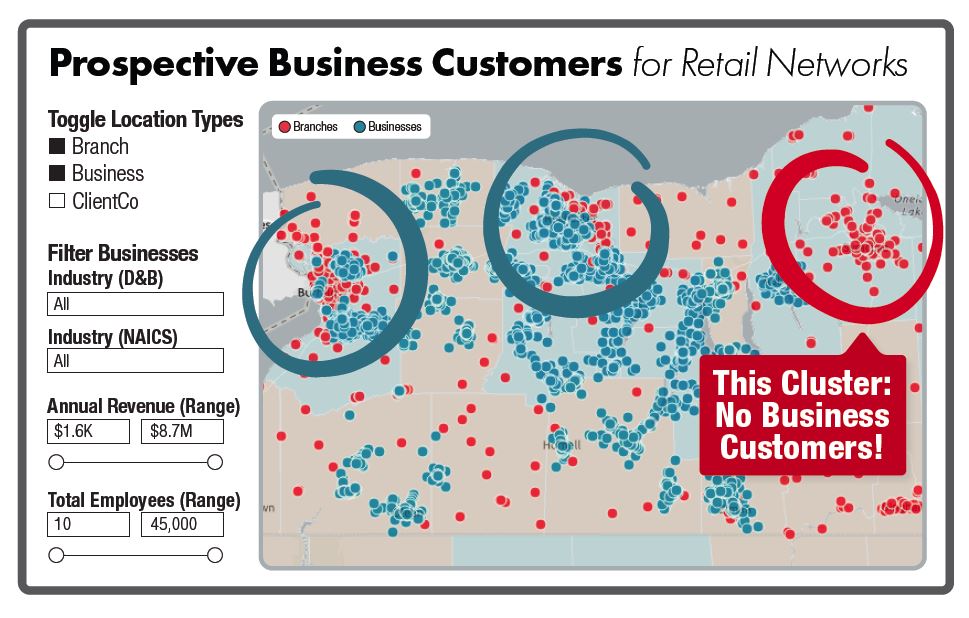
And this is hardly random. It’s easy to filter those businesses—and see the results visually, instantly—by factors such as revenue, employees, and industry. We know this is an article about cost-cutting, but we want to emphasize strategic cost-optimization. That means you have to consider both revenue preservation as well as revenue lift. Imagine the power of feeding this type of local-business data into your commercial-lending sales team’s CRM database. The Lab does all of this routinely.
By the way, all of this data is dynamic: When the databases that we plug into get updated, all of the dashboard information updates, too, in real-time.
Here’s one more BI-enabled tool that should whet your appetite, if it hasn’t been already: The Lab even pulls state Department of Transportation data to overlay vehicular traffic data over a bank’s branch network, measured in “cars passing per day by branch.” It’s an astonishing level of detail that any bank executive should feel naked without. And it’s “standard equipment” on each of our bank engagements.
Branch rationalization scorecard and analytics
All of this retail banking business data can then be aggregated and crunched to create scorecards which rank individual branches within a bank’s network. Here’s a scorecard (anonymized, of course) which combines different metrics, including daily traffic, and then ranks the branches with a composite score that can top out at “1.0.”:
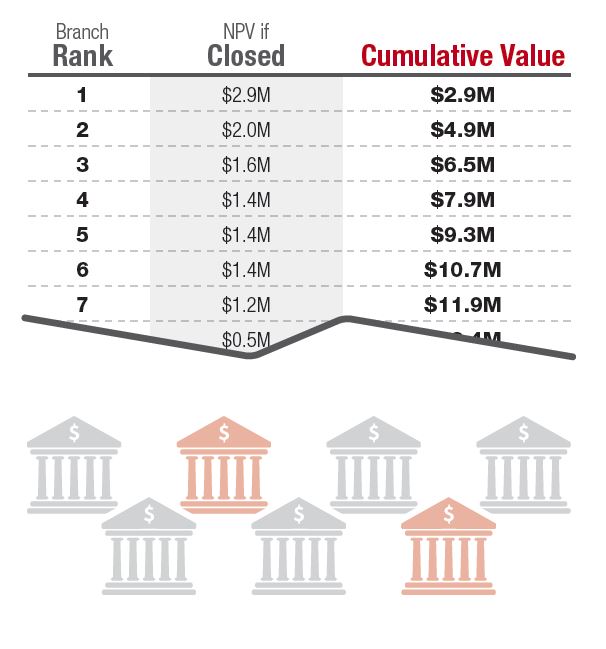
Using all of the data, it’s also easy to rank the banks by net present value, or NPV. In this anonymized graph, you can clearly see which branches are profitable vs. which ones aren’t—and the net gain, or cost, they’ll likely have on the bank in the next five years:
Here’s perhaps the most interesting view. It’s a quadrant which The Lab created, which maps a bank’s branches along two axes: performance and growth area:
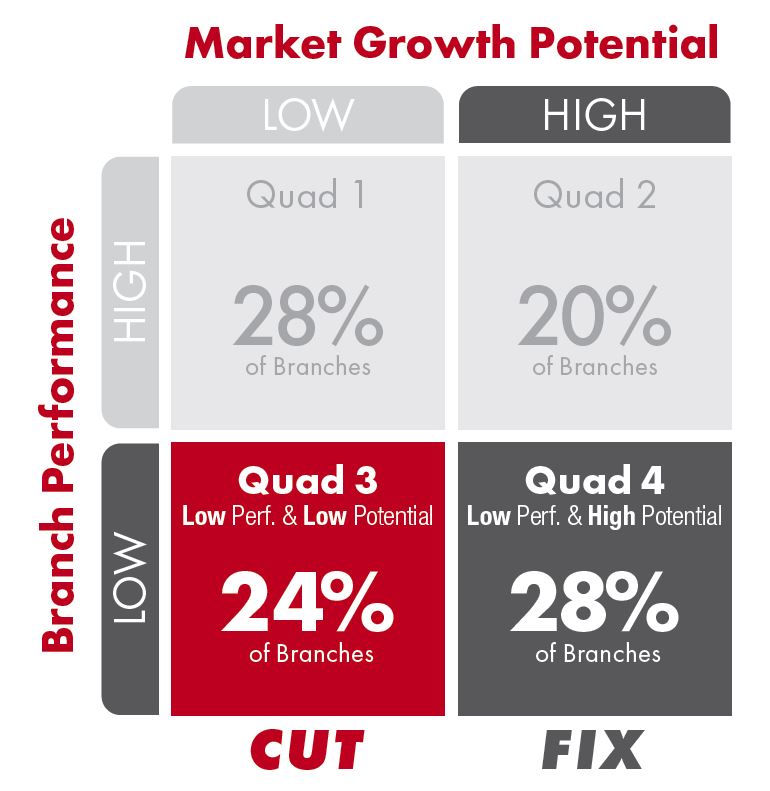
Take a look at Quadrant 4. It’s the overlap of “low performance” yet “high growth area.” That’s a huge opportunity: It tells any savvy executive: “Let’s send a tiger team out there and fix this branch!” Do you currently have this laser capability for your revenue-lift efforts?
Fine-tuning the footprint: Branch consolidation
When it comes to the difficult decision to consolidate, or even close, branches, you need trustworthy data to guide you.
Federal regulations purposely make it difficult to close a branch outright (for example, it’s forbidden to leave a given geography “unbanked”). But local consolidations can be less onerous. The Lab recently evaluated a bank which had two different branches within a mile of each other.

Although the locations were adjacent, the metrics for prospective value couldn’t have been more different. One was in an area that was growing, quickly; the other wasn’t. We could see that the stagnant growth location was gradually losing customers, whereas the high growth location was stable.
Next, we overlaid geographic-based insights. What’s around those branches? For example, do you want to maintain a branch that’s residing in a sleepy strip mall (or, worse, inside a moribund shopping mall), or one that’s beside a vibrant Walmart as its anchor store?
Armed with this visual data, our executive’s decision was inarguable. As we’d mentioned, shuttering a location is not only a last-resort measure; it’s also difficult. Having been down this road, The Lab has developed a helpful checklist which covers in-the-weeds details down to things like breaking leases and shutting off utilities. (Contact The Lab if you’d like to get a copy of this checklist.)
The bottom line
The numbers don’t lie. Following these steps can deliver a massive cost-cutting impact to banks. Here are some of the numbers that The Lab has delivered to banks, typically within six months or less:
- For a 350-employee bank, The Lab delivered $3.3 million in annual savings—roughly half were accrued in the first 30 weeks of Year One. That’s typical.
- For a 2,500-employee bank, The Lab delivered $13.6 million in annual savings.
- For a 10,800-employee bank, The Lab delivered $74.3 million in annual savings.
These are real numbers. These are real results. To transform your branch network, and take advantage of this kind of volatility-proofing power, call (201) 526-1200 or email info@thelabconsulting.com to contact The Lab today.