


A complete three-part guide for addressing the “perfect storm” of adverse market conditions confronting credit unions now—and preparing for a forever-changed, volatile future
The credit union industry is reeling amid an onslaught of challenges that include:
- Constant market shocks
- Generational turnover with a transient workforce as replacements
- Ever-increasing core system capability constraints and cost
- Members demanding 100-percent automated and digital experiences
- Interest-rates hikes crashing loan sales
These factors combine to create a volatility threat that requires managing revenue declines and cutting costs while simultaneously increasing operational effectiveness—especially operational flexibility. As a credit union executive, you’re forced to immediately address three “big rocks” of operational efficiency:
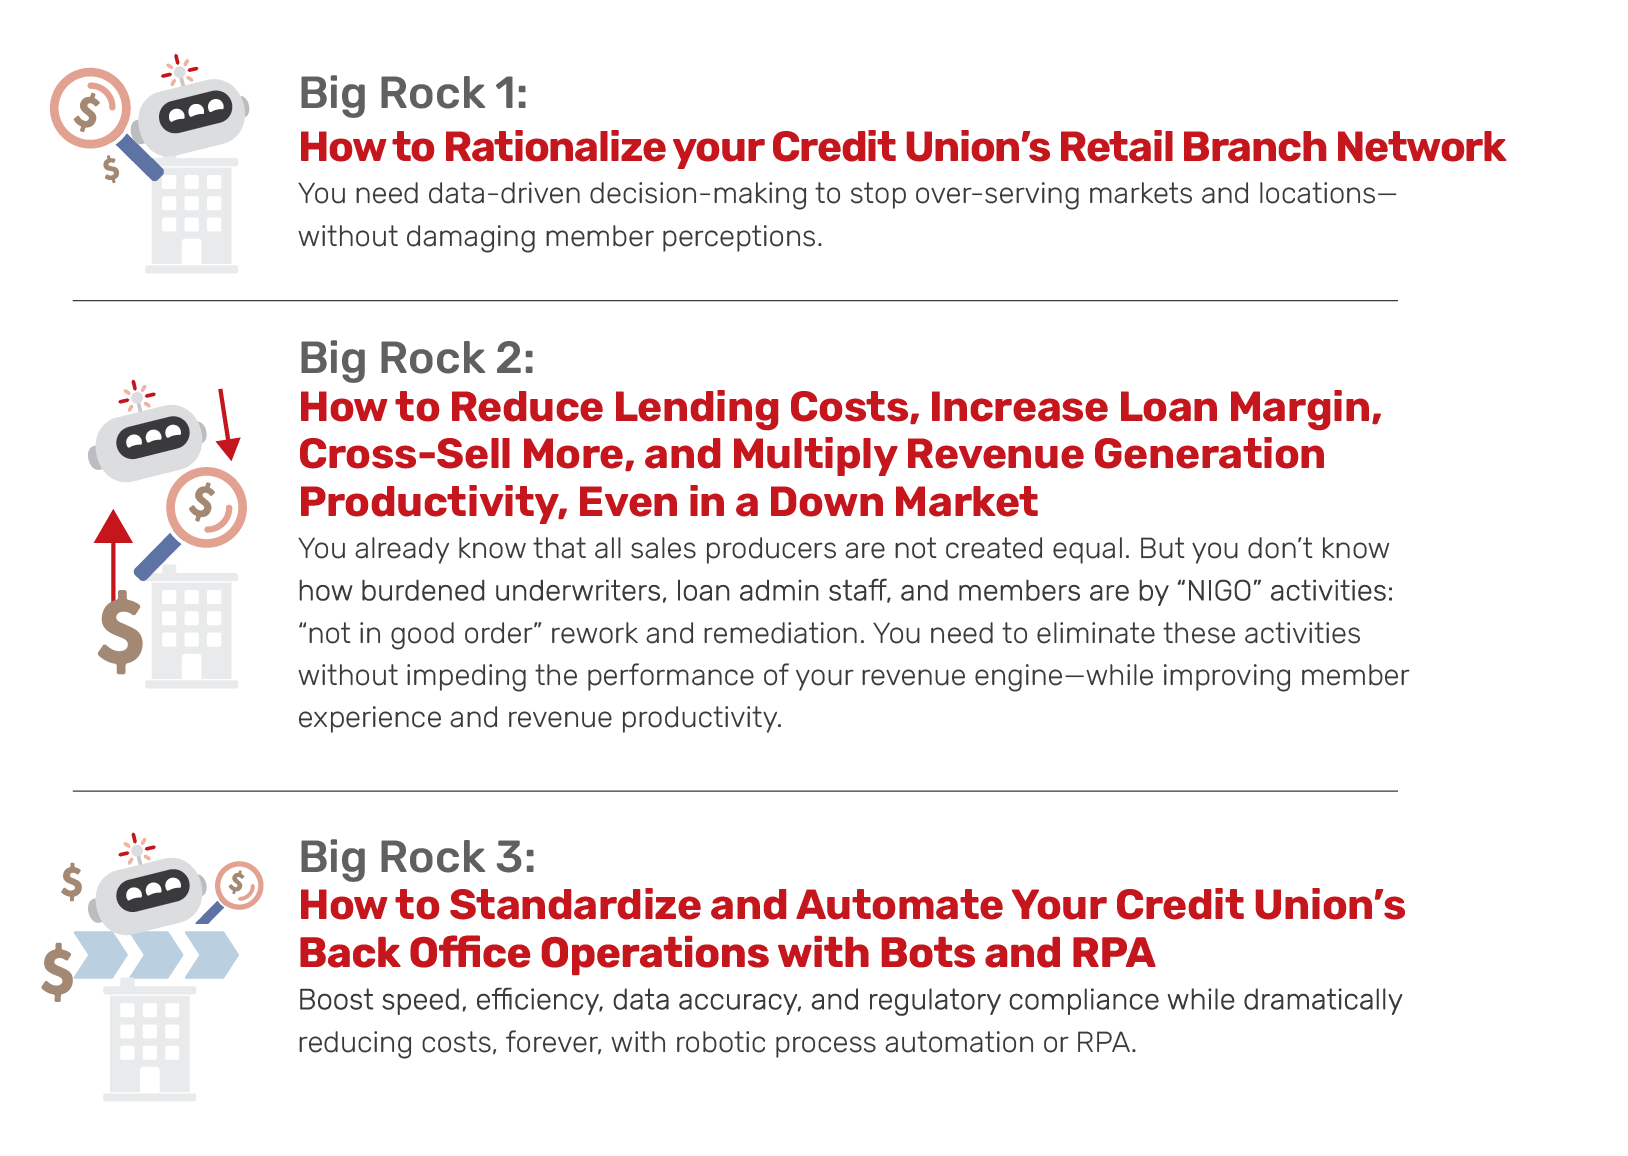
Big Rock 1: How to Rationalize your Credit Union’s Retail Branch Network
You need data-driven decision-making to stop over-serving markets and locations—without damaging member perceptions.
There’s no going back
While today’s economy will certainly recover, ways of doing business—and credit unions—will not. The lessons learned of the past two years—of disruption and volatility—are too powerful to ignore.
Importantly, credit union executives need organizations that deliver “operating leverage”: the capability to grow revenue much faster than costs—and, in a downturn, the flexibility to absorb large declines in revenue with minimal operational damage.
The good news is that today’s confluence of disruptive events offers credit union executives a rare opportunity to cut costs, improve processes, and volatility-proof their businesses against the inevitable shocks of the future—at the same time.
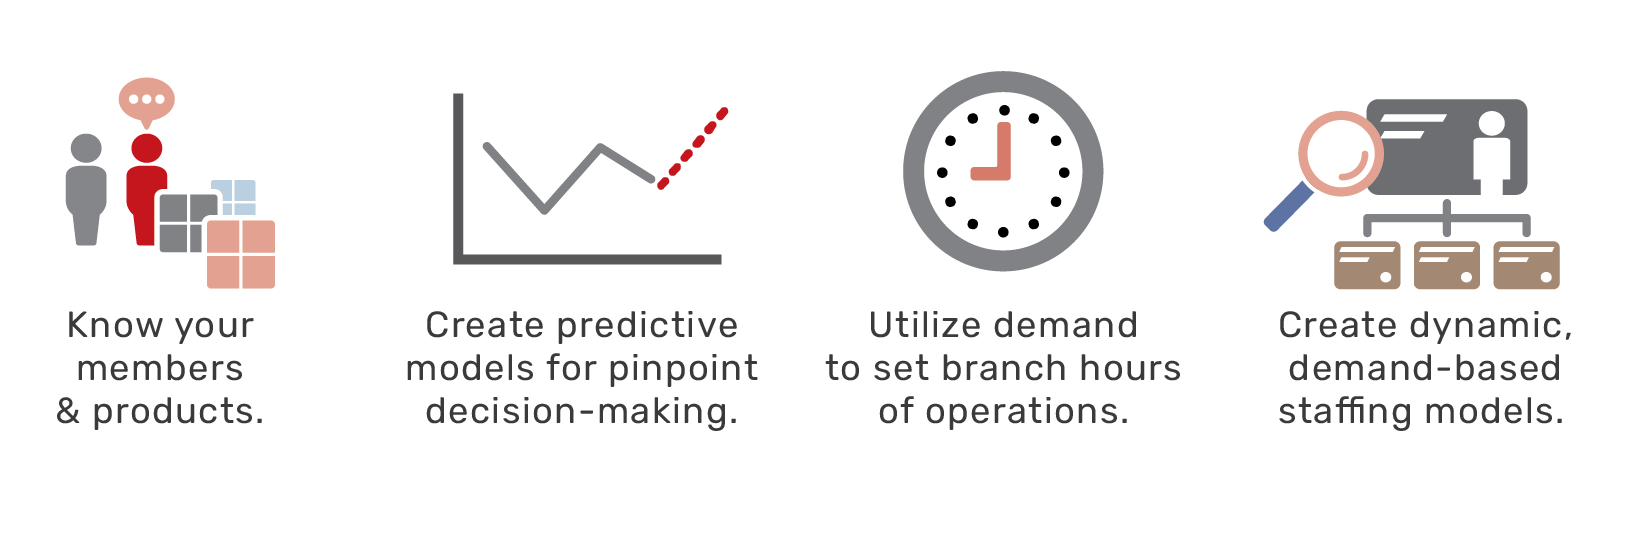
4 keys to cost efficiency in retail credit union branch networks
Cutting costs across-the-board in branch networks can be counterproductive. But strategically reducing over-service can deliver a competitive gain. This effort can be broken down into these steps:
- Know precisely what member types are served by each branch, based on the deposits generated, the transactions being processed, and the products being purchased.
- Create predictive models to estimate losses/transfers of members and deposits. Losing unprofitable members to competitors is a valuable benefit, so ensure that Step 1 measures profitability at a granular level: members, products, and sales producers.
- Change hours of operation based on demand—hours of transactions actually being processed—so staff aren’t idle and the network isn’t overstaffed.
- Create a retail staffing model with enterprise-, division-, and branch-level views, using in-branch transaction data.
All of this, clearly, affects branches slated to remain open. The “even bigger rocks” of branch consolidation and branch footprint reduction will be addressed later in this article.
Improving operations in retail branch networks: Efficient staffing
One of the first things a credit union needs to do, when it’s looking to “bust the big rock” of the retail branch network, is study its data, re: branch transactions.
Surprisingly, most credit unions fail to do this. We know, because at The Lab, it’s often one of the first things we do. The credit unions will have the data, but they haven’t leveraged it—cleaning it, parsing it, creating useful KPIs based on business-relevant ratios, and then plugging it all into an advanced predictive and AI analytics platform that provides invaluable visualization.
The power of visualization cannot be overstated. Executives can quickly see where value is generated and, more importantly, where it is squandered—usually with good intentions. The Lab calls this costly anomaly Virtuous Waste™.
Helpful Hint: Don’t wait for the IT shop to get around to addressing the critical business task of leveraging existing data from core systems. They’ve got their hands full with daily operations.

So, you’ll want to find out what member types are being served by each branch. Which are the most valuable? Which are the least valuable? Similarly, you’ll want to see which transaction types are taking place, on a branch-by-branch basis: where is the simple check-cashing taking place, vs. the more valuable commercial-loan and mortgage applications? Then you’ll want to dive down into even greater detail, to a day-by-day and even hour-by-hour analysis. You certainly don’t want staffers sitting around idly. You don’t even want a branch to be open if no one is visiting it during certain days or hours.
Armed with this information, especially if it’s visualized in predictive and prescriptive KPI analytics, you’ll be able to put forth a concise, straightforward proposition to fine-tune operating hours—and even move employees—on a branch-by-branch basis to meet forecast demand. Today, you need this capability in real-time—and it’s there. But it’s lurking below the surface noise that results from the friction between the need for in-house data transparency, IT’s operational culture, and the business lines’ unfamiliarity with the wealth of leverage-worthy data on hand.
Misperceptions in branch over-staffing
Today’s credit union C-Suite is often torn between the pressures from the market, and the board, to cut costs—and internal voices that are clamoring for more staff.
The Lab can add clarity to this conflict. We’ve seen credit unions where retail leaders claimed it was “irresponsible” to have, say, fewer than seven staffers in a given branch. Yet a simple analysis of the data revealed that these staffers were processing just two transactions per hour. It’s hard to justify the need for seven tellers when they’re doing the work of just three. The key to making this change quickly is KPI data visualization through advanced predictive and AI analytics.
Here’s another “big rock” in credit unions—one that’s so big, we could devote an entire playbook to it. And that’s the huge rock of reducing—ideally, eliminating—performance variance among individual employees performing identical tasks.
Most organizations use overall averages to measure employee performance. This lulls executives into perceiving that the employee-to-employee variance is probably negligible—perhaps in the 15- to 30-percent range. If this were true, it’s not worth the effort to investigate further. But it isn’t true. Executives are stunned to see that the variance is typically 2-7x between the top performers and the bottom quartile.
When this data is presented in a visualized format, it’s clear that the top performers shine… and that they get a raw deal. They are virtually unrecognized, while the bottom quartile do a fraction of the work and are allowed to be perceived as nearly equivalent in value to the business.
Executives are stunned to see that the variance between the top performers and the bottom quartile is typically 2-7X.

Applying market demographics to control cost in retail credit union branches
So far, this article has focused largely on internal data available to credit unions: headcount, hours of operation, types of transactions processed. Yet it’s also possible to pull, overlay, and visualize external information, which provides credit union executives with unprecedented decision-making effectiveness. The Lab performs this service routinely for credit unions of all stripes and sizes, truly leveling the playing field: We give them the type of information that you might think only the top three or four credit unions, nationally, can get their hands on. That’s not true.
Consider these intriguing details.
The “power” in advanced predictive analytics platforms lies in their ability to instantly crunch data from as many sources as you can throw at them—and then serve up the resulting insights in dashboards that allow seemingly infinite deep-dive options to paint an inarguable picture of the optimal credit union-branch landscape. Often, no matter how many scenarios you attempt, the answer is obvious and inescapable. Interminable, organizational debate is ended.
And when we say “landscape,” we mean it quite literally. We’d mentioned “external data” above. This means, for example, U.S. census information, showing not just population and income levels, but trends in population—which areas are growing (or shrinking), and at what rates. It’s a godsend for projections. Imagine seeing, on an actual map, your branch network as it pertains to the area’s household income, disposable income, age group, population density, and trends. It’s almost like having a crystal ball. The Lab delivers this quickly and routinely.
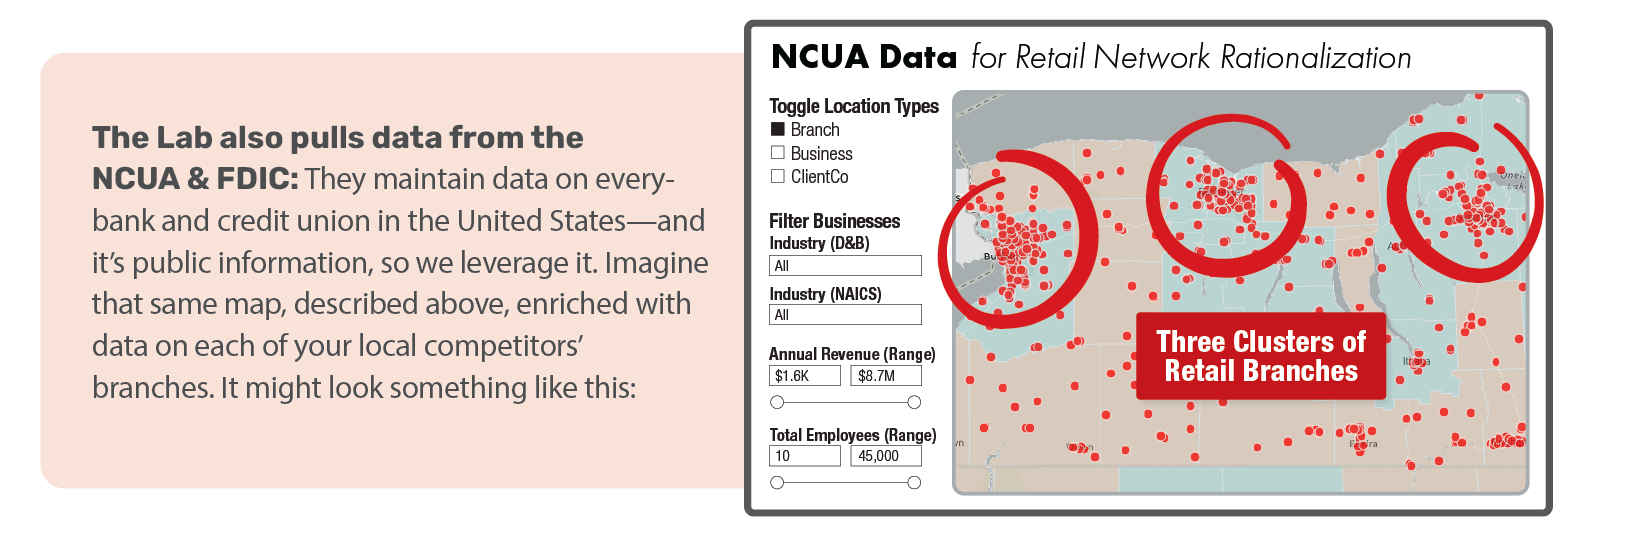
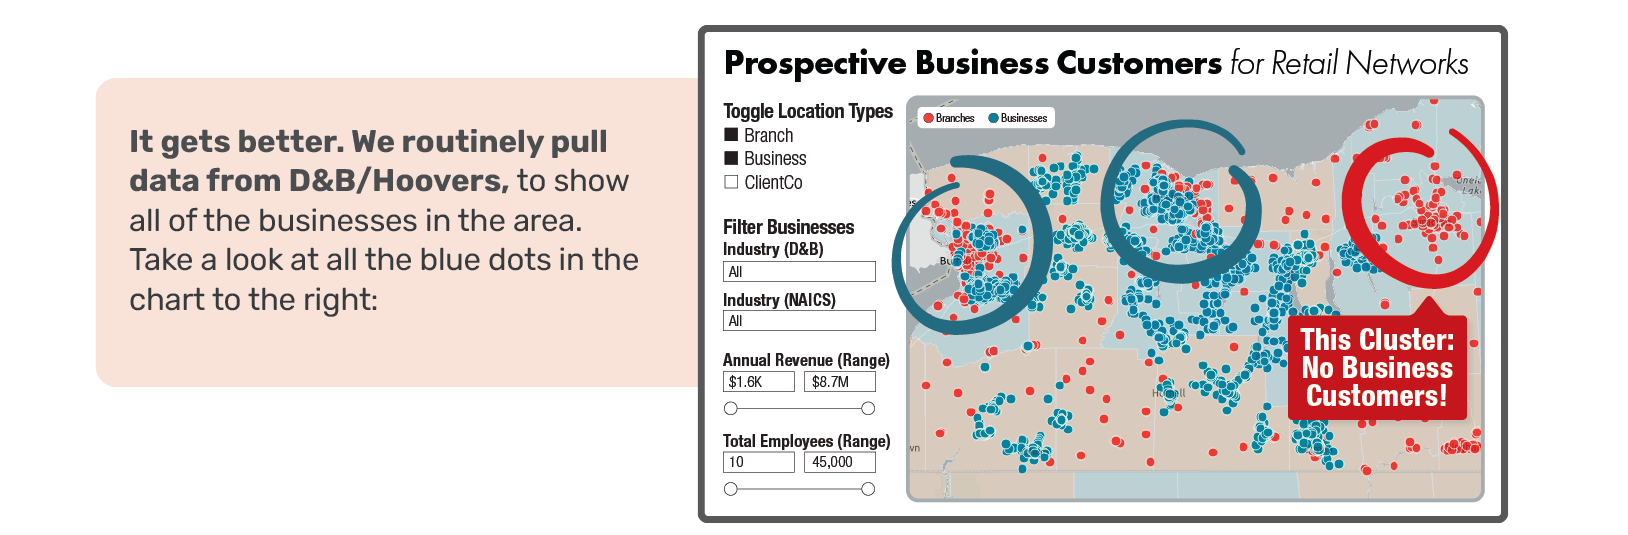
And this is hardly random. It’s easy to filter those businesses—and see the results visually, instantly—by factors such as revenue, employees, and industry. We know that this section of the playbook is about cost-cutting, but we want to emphasize strategic cost-optimization. That means you have to consider both revenue preservation as well as revenue lift. Imagine the power of feeding this type of local-business data into your commercial-lending sales team’s CRM database. The Lab does all of this routinely.
By the way, all of this data is dynamic: When the databases that we plug into get updated, all of the dashboard information updates, too, in real-time.
Here’s one more advanced predictive and AI analytics-enabled tool that should whet your appetite, if it hasn’t been already: The Lab even pulls state Department of Transportation data to overlay vehicular traffic data over a credit union’s branch network, measured in “cars passing per day by branch.” It’s an astonishing level of detail that any credit union executive should feel naked without. And it’s “standard equipment” on each of our credit union engagements.
Branch rationalization scorecard and analytics
All of this retail credit union business data can then be aggregated and crunched to create scorecards which rank individual branches within a credit union’s network. Here’s a scorecard (anonymized, of course) which combines different metrics, including daily traffic, and then ranks the branches with a composite score that can top out at “1.0.”:
![]()
Here’s perhaps the most interesting view. It’s a quadrant which The Lab created, which maps a credit union’s branches along two axes: performance and growth area:
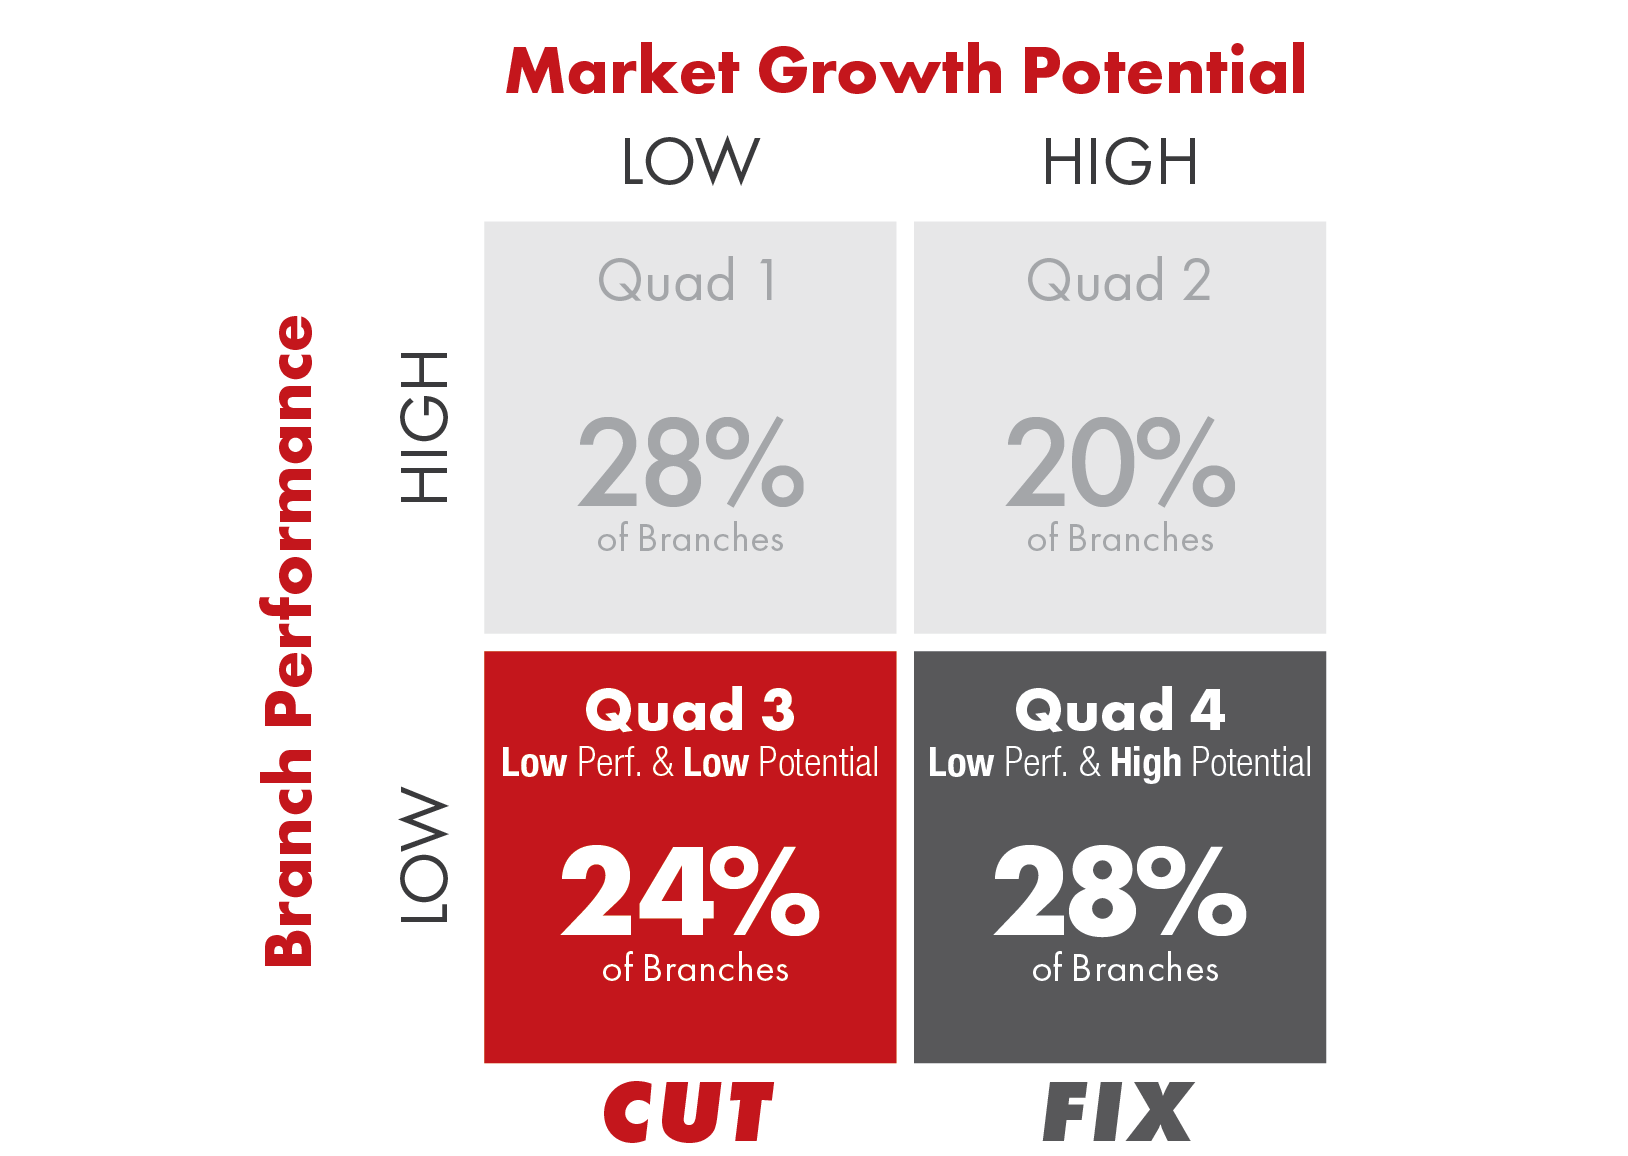
Take a look at Quadrant 4. It’s the overlap of “low performance” yet “high growth area.” That’s a huge opportunity: It tells any savvy executive: “Let’s send a tiger team out there and fix this branch!” Do you currently have this laser capability for your revenue-lift efforts?
Fine-tuning the footprint:
Branch consolidation
When it comes to the difficult decision to consolidate, or even close, branches, you need trustworthy data to guide you.
Federal regulations purposely make it difficult to close a branch outright.
But local consolidations can be less onerous. The Lab recently evaluated a credit union which had two different branches within a mile of each other.

Although the locations were adjacent, the metrics for prospective value couldn’t have been more different. One was in an area that was growing, quickly; the other wasn’t. We could see that the stagnant-growth location was gradually losing members, whereas the high-growth location was stable.
Next, we overlaid geographic-based insights. What’s around those branches? For example, do you want to maintain a branch that’s residing in a sleepy strip mall (or, worse, inside a moribund shopping mall), or one that’s beside a vibrant Walmart as its anchor store?
Armed with this visual data, our executive’s decision was inarguable. As we’d mentioned, shuttering a location is not only a last-resort measure; it’s also difficult. Having been down this road, The Lab has developed a helpful checklist which covers in-the-weeds details down to things like breaking leases and shutting off utilities.
Contact The Lab if you’d like to get a copy of this checklist.
Big Rock 2: How to Reduce Lending Costs, Increase Loan Margin, Cross-Sell More, and Multiply Revenue Generation Productivity, Even in a Down Market
You already know that all sales producers are not created equal. But you don’t know how burdened underwriters, loan admin staff, and members are by “NIGO” activities: “not in good order” rework and remediation. You need to eliminate these activities without impeding the performance of your revenue engine—while improving member experience and revenue productivity.
Uncover the trickiest—yet most powerful—data-driven process improvement: How to supercharge your credit union’s revenue engine—loan sales and origination all the way through servicing.
Ask any credit union executive to “cut costs in their lending operation” and they’ll look at you like you’re insane. That’s the revenue engine! You should never, ever make cuts there! It would be like shooting yourself in the foot.
That’s the common perception. Unfortunately, it’s a misperception. It’s actually quite possible to “rebuild this airplane in flight,” slashing insidious rework and “not in good order” information being exchanged between your staff, and members, while turbocharging productivity and revenue—at the exact same time.
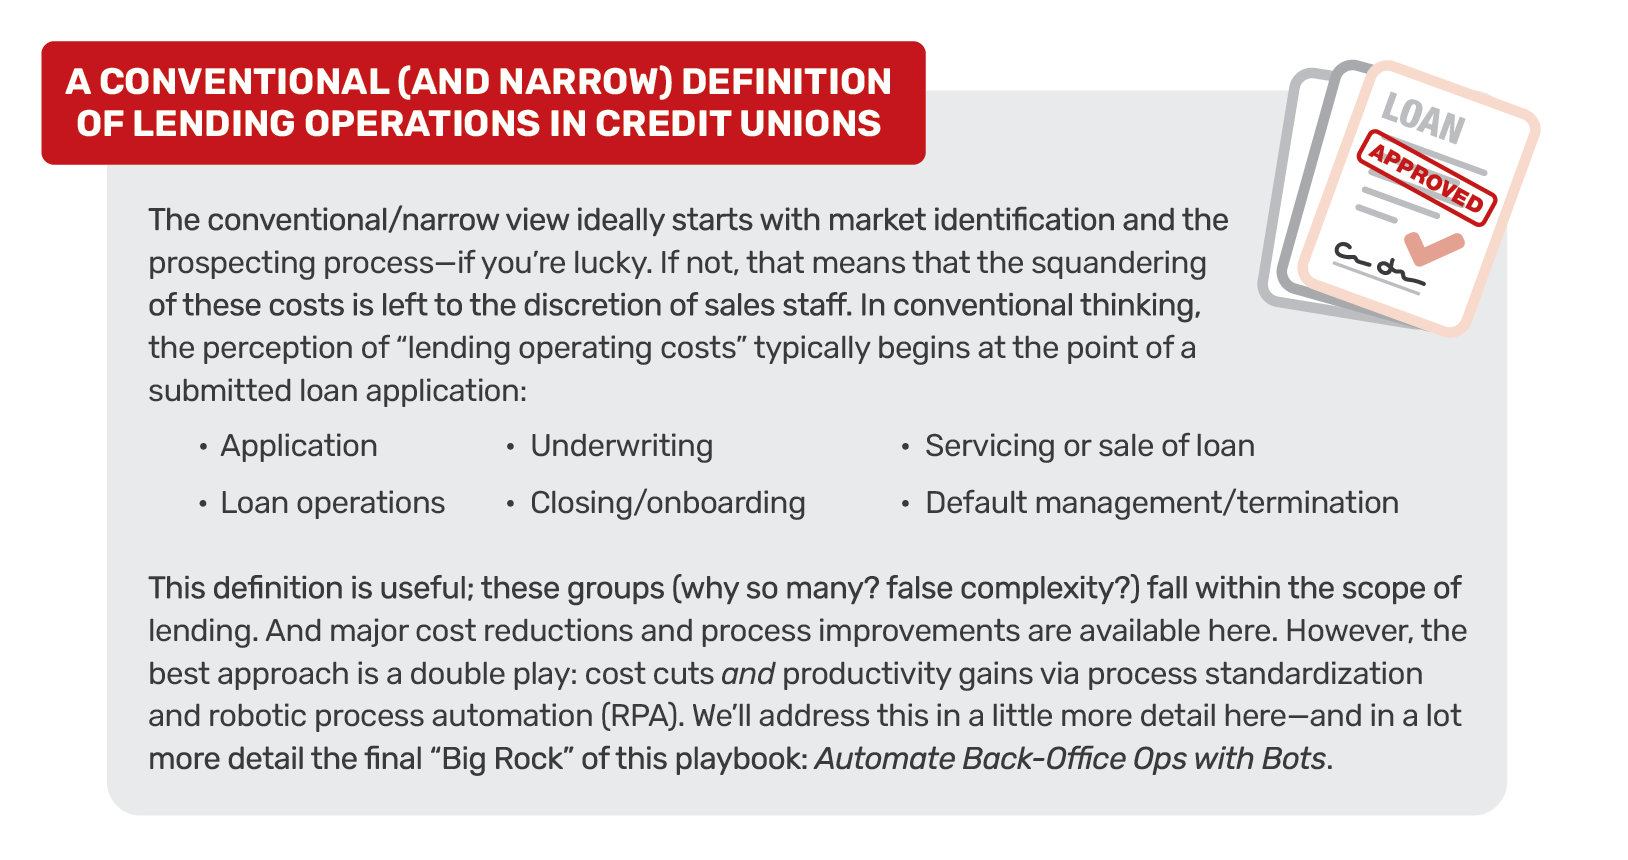
So, what’s mis-perceived? It’s the notion that “lending” begins with the salesperson’s (loan producer’s) intangible “sales magic” and ends with mundane, tangible loan operations.
That’s myopic. It overlooks three other major components of the process—and three fourths of near-term “big-rock” process improvements. The final fourth? Yes, loan producers themselves (i.e., the sales force and their admin staff). Of course, producers also represent an essential—and fix-able—component for multiplying productivity. But in order to truly improve costs and simultaneously increase productivity/revenue, you need broaden your perception of “savings sources” to include:
- Products
- Members
- Prospects
- Producers
Each of these offer rapid “big-rock” operational improvement, yet rarely come under scrutiny—perhaps because they fall far outside of what almost everyone—from credit union execs to employees and tech providers—conventionally view as the scope of “lending operations”.
Fortunately, it doesn’t take much research to uncover waste and opportunity within each of the four building blocks of lending: products, members, prospects, and producers. Even simple interviews will reveal anecdotes that describe waste in each. The hard part is pinpointing precisely what costs can be lopped off. That begins with superior data and analysis.
As we discussed in the “Big Rock 1” portion of this playbook, a lack of relevant, detailed data—properly sourced, shaped, and combined (those terms are significant for advanced predictive and AI analytics, technology)—will impair any operational improvement effort. Yet compared to their retail branch networks, credit unions typically have far less data readily available for evaluating these four new building blocks of the expanded lending landscape.
Eliminating this blind spot is a two-step process: First, invest in a modest amount of data collection and cleanup—no data lakes needed! Advanced analytics technologies already exist in your technology stack that can handle this task with minimal contribution from IT. They are drastically underleveraged in most businesses due to a lack of investment in standardization of process and data. Second, augment this data with a bit of activity-level documentation: operational observation and business process mapping. This is how you quickly pinpoint substantial, risk-free cuts in needless lending costs that are draining margin and impairing operational leverage: that is, the ability to increase income without a comparable increase in costs.
Now, with our definition of “lending” properly expanded, let’s review the cost-cut savings—and productivity-boosting benefits of each component.
Cut Lending Costs In Your Credit Union: Products
Amazingly, most credit unions fail to consider their own products when they’re looking to cut costs. That’s because “product” translates to “revenue.” And generating revenue is unquestionably a virtuous activity; any revenue must be good revenue, right? How could it be wasteful?
Not all products are created equal. Some— the “ideal” products which you must rapidly identify—provide ample revenue streams that include margin. Other products require modifications but can be improved to generate margin levels closer to the ideal; these are the “lift” candidates.
And another set of products—you guessed it—actually squander margin while delivering revenue. These products cost more to maintain, promote, and deliver than the margin they deliver—sometimes these costs exceed the revenue they deliver. These represent drag on the revenue engine.
Sure, everyone views revenue-generation as virtuous activity. However, your credit union, right now, has products in its portfolio that actually drain it of margin and profit. These are what The Lab calls Virtuous Waste® products. See the graphic below:
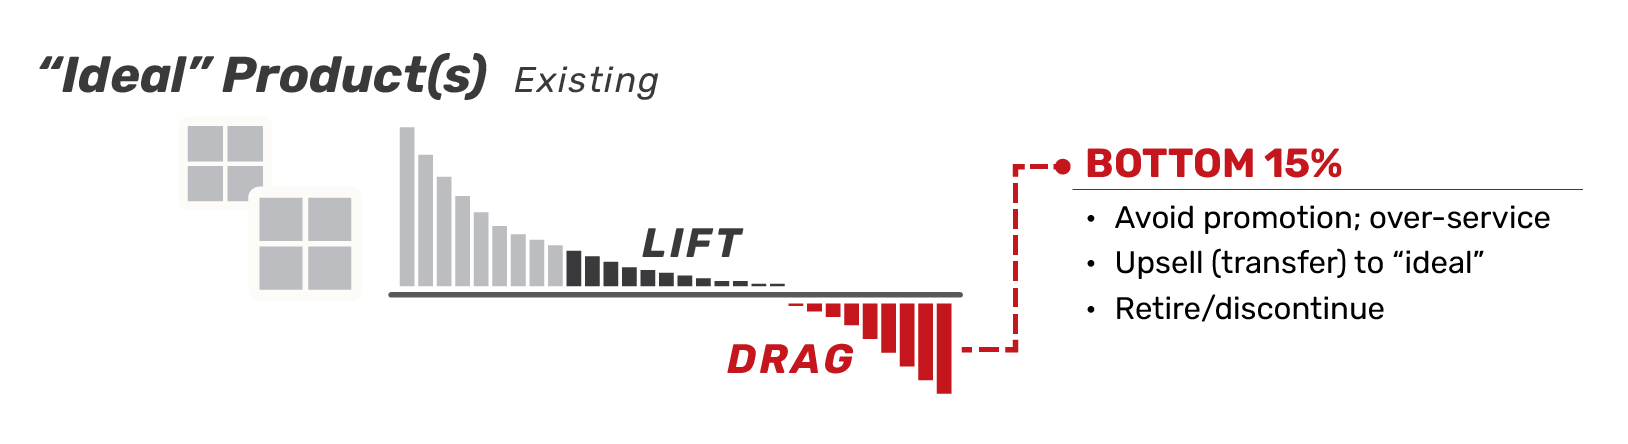
How do you crush the cost of this virtuous waste? How do you eliminate this drag on your revenue engine? First, you perform the analysis to identify it. Should you increase prices? No! Crush costs, not member experience! There are numerous options:
- Stop promoting these products.
- Retire/discontinue them from the portfolio.
- Trade/swap them for “ideal” products—provide member incentives.
It’s important to begin your lending analysis and cost-cuts with products because these can affect the profitability and the savings potential of the other categories—especially members and prospects.
Food for thought: If margin wasting lending products can be misperceived as valuable revenue generators, how else might these products be misperceived? They are mistaken as falsely complex and dissimilar—“unique.” Lenders insist that C&I (commercial and industrial) loans are vastly different from CRE (commercial real estate) loans. They are not. All lending products are more alike than different— even consumer and SBA loans. Eighty percent of their underlying activities can be standardized, automated, and serviced by simplified organizations. We’ll tackle this opportunity in the next chapter in this article: “Cost Cutting Big Rock 3: Automate Back-Office Ops with Bots.”
Cut Lending Costs In Credit Union Ops: Members
This is another case of “Don’t ever touch that!” After all, members deliver revenue for lenders. Yet look more closely, and you’ll find more virtuous waste.
First, identify the “ideal member”: high margins, low service costs. You’ll quickly see that they’re among the minority.
Next, identify the larger segment of also ran, moderately profitable members. These can be improved. And, finally, define that painfully long, long-tail of “member drag.” These borrowers pull down lending performance and profitability. They cost more to service than the margin they deliver—some even cost more than all of the revenue they deliver. See the graphic below:
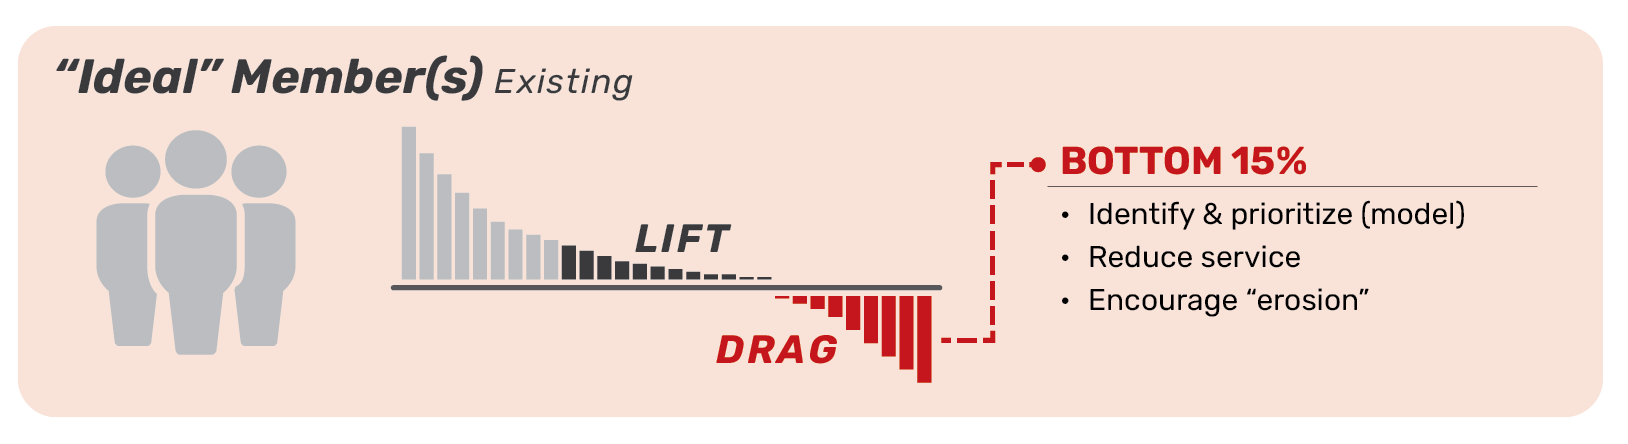
How do you eliminate “member drag” on the revenue engine? There are numerous ways
- Identify, prioritize, and assign them to a specialized team.
- Reduce service to unprofitable members.
- Add fees or increase rates for members demanding “over-service.”
- Encourage “erosion” (use predictive modeling).
In other words, keep the highly profitable members, while improving the moderately profitable. Slough off the unprofitable ones—let your competitors have them!
Increase Profitability For Your Credit Union: Prospects
By now, the cost-crushing/productivity-multiplying methodology should be quite clear: Define the “ideal.” This is the “power source” for your revenue engine. Improve the moderate performers to reduce the friction. And lop off the long tail of irredeemable “drag.” All of these precepts apply to prospects, too.
Start with the “ideal.” Who are the existing ideal members and what are they buying? These answers will provide the template for improving the “moderate” segment: the perfect prospects for upsell opportunities. This is the lowest-hanging fruit for prospecting—the “lift.”
For most credit unions, the next step requires extensive development. That’s because the prospecting process is typically undocumented and unstructured. As mentioned above, the squandering of these costs is left to the discretion of sales staff.
Who are the new ideal members who should be onboarded? Identify and prioritize them for the sales funnel and marketing efforts. Equally important, identify and prioritize low-value prospects that should be screened out of costly prospecting efforts from the beginning. See the graphic below:
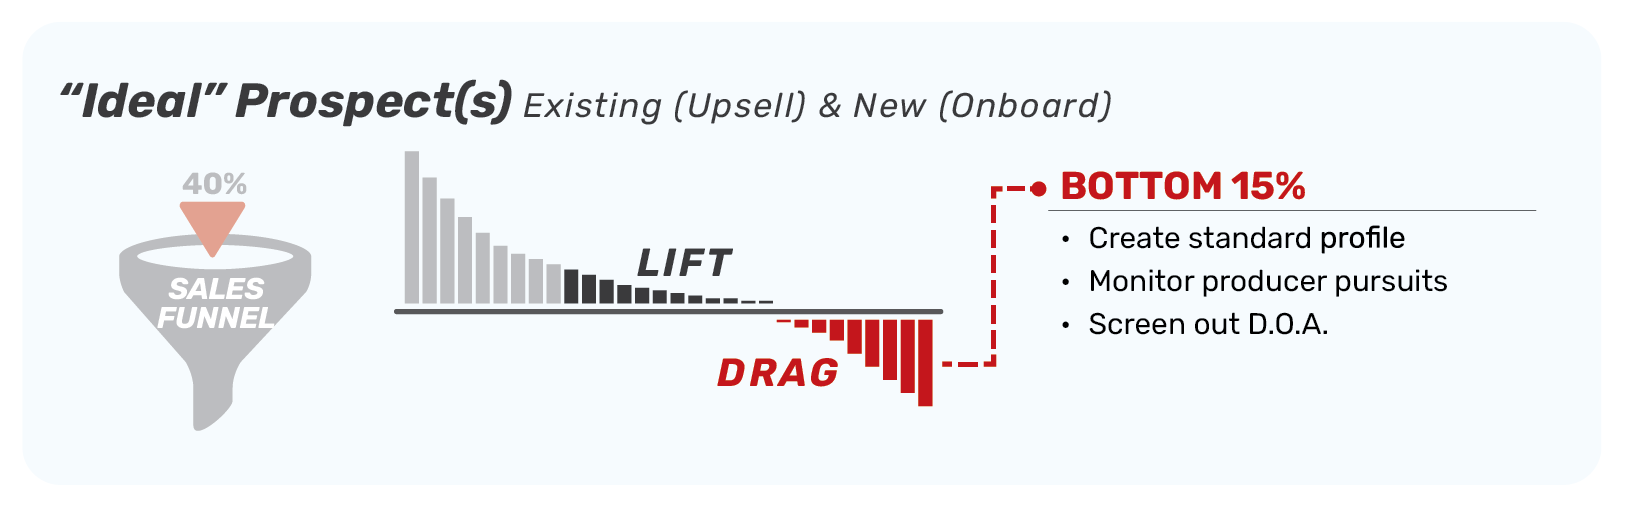
How do you eliminate “prospect drag”? There are numerous ways:
- Create a standard “ideal” profile
- Monitor/prioritize producer pursuits
- Prioritize “up-selling”: existing products to existing members
- Screen out D.O.A. (dead on arrival prospects
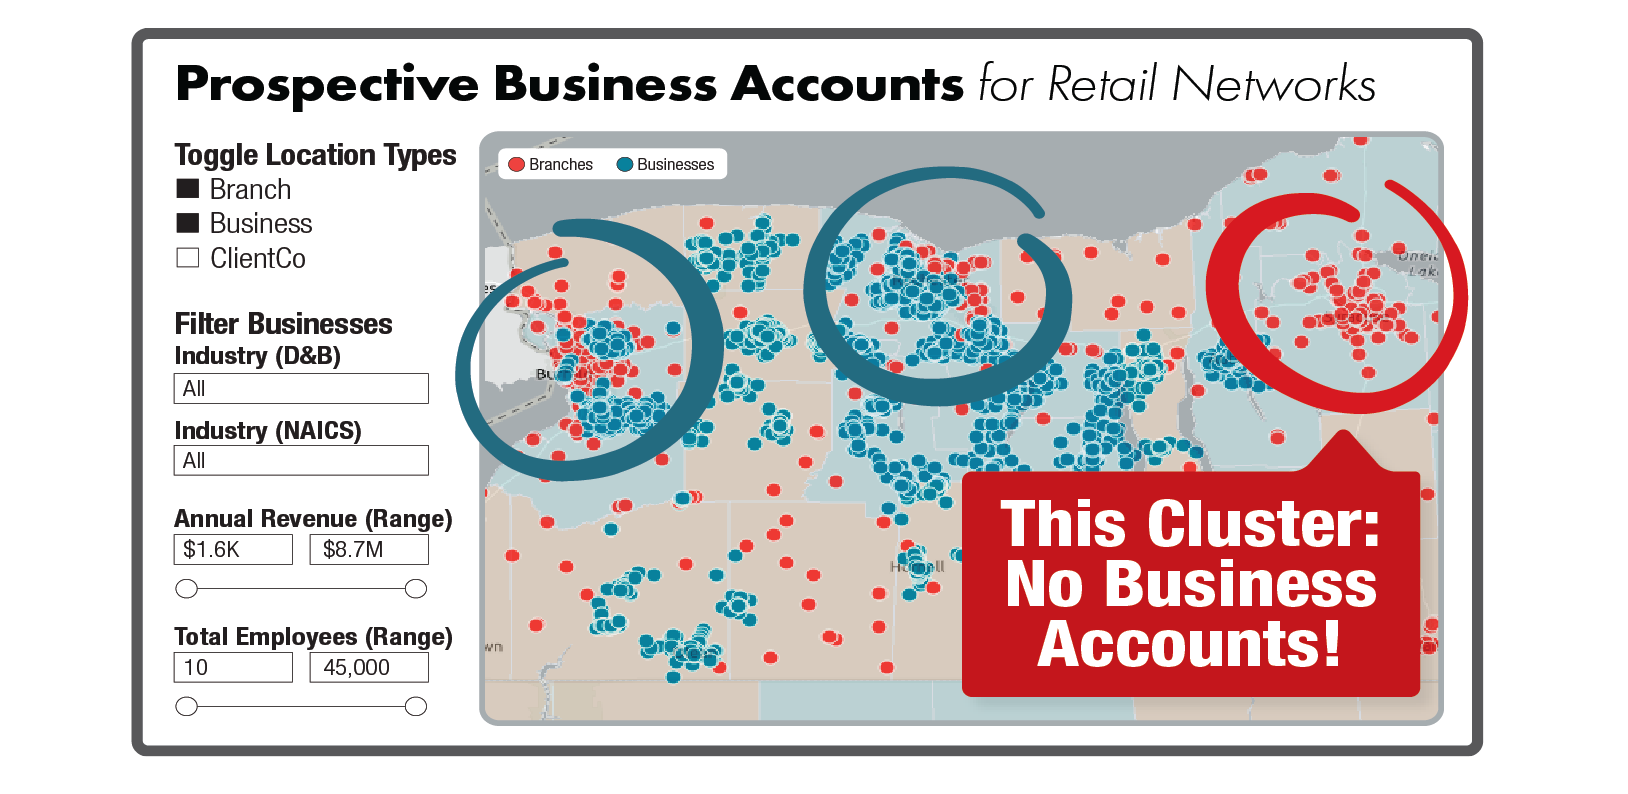
But precisely how do you avoid leaving prospecting to the sole discretion of the sales staff? This is a massive opportunity for advanced predictive and AI analytics technology. It arms your sales team with inarguable data from trusted sources: everything from FDIC info on competitors’ locations to D&B/Hoover’s data on businesses within striking distance of your branch network, to Department of Transportation information on vehicular traffic counts near individual branches! A picture is worth a thousand words:
How To Improve Lending Costs And Productivity In Credit Unions: Producers
Now we finally get to the category where the intuitive, knee-jerk reaction might tell you to start: Producers.
The costs of producer underperformance can be staggering—so can the rationalizations from sales management for keeping under-performers. Undermanagement of product and member profitability contribute to producer under-profitability. However, the failure to manage prospects does the most damage.
Since this responsibility falls to senior sales management, it might help explain why they are reluctant to terminate poor producers—and why they have few ideas for improving the performance of the moderate performers.
Again, define the ideal. Identify the top producers, the next-tier, moderate performers—and the long tail of unprofitable drag. See the graphic below:
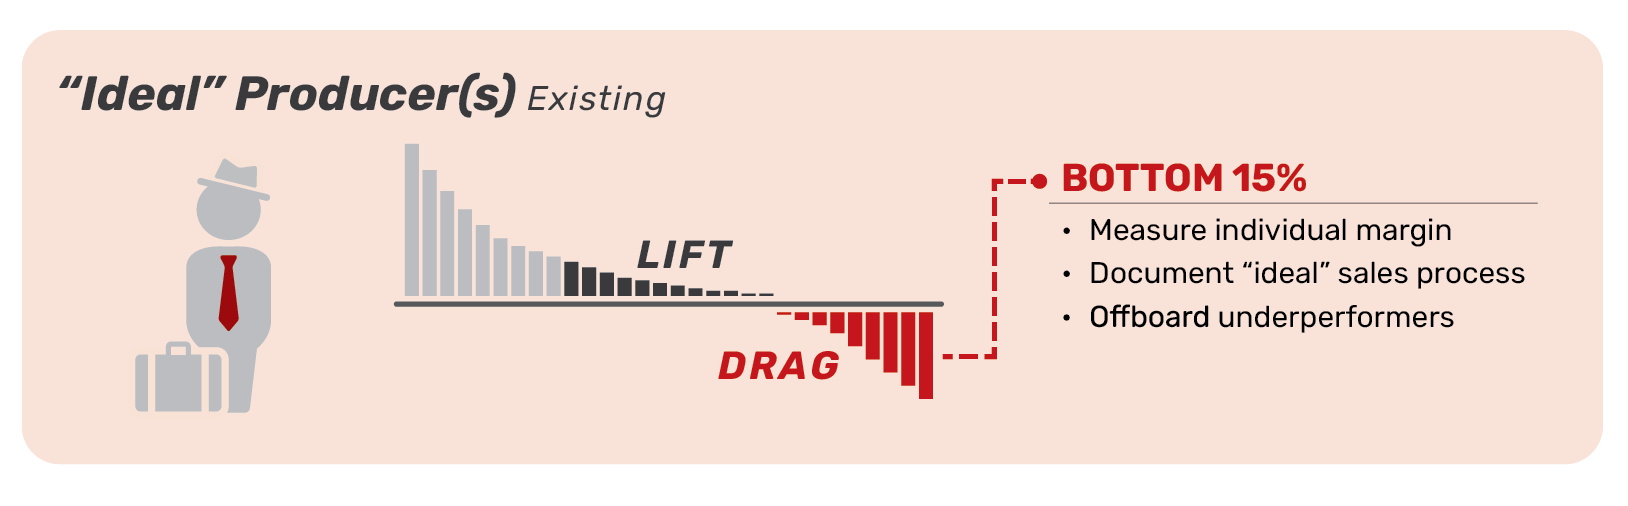
How do you eliminate “producer drag”? After transforming and tightening up the prospecting process, there are numerous ways:
- Measure individual margin. Document the variance.
- Document and enforce the “ideal” activity level sales process.
- Focus on lifting the performance of the moderate performers.
- Offboard persistent under-performers—promptly.
You already know that all sales producers are not created equal. But you don’t know how burdened all sales producers are by “NIGO” activities: “not in good order” rework and remediation. You need to eliminate these activities without impeding the performance of your revenue engine—while improving member experience and revenue productivity.
Update Loan Index Rates in Documentation/Compliance System and Core
This automation uses current index rates to update rate information on both the credit union core system and the documentation/compliance system, where it is used to update rates on required loan products.
Saves 800-3,000 hours
Flood Report Processing and Reconciliation for Real Estate Loans
These two automations process the daily flood review data from the loan origination system, the flood determination system, and compliance system. Then, they reconcile and ensure that all flood reporting activities were completed for the day.
Saves 1,500-2,500 hours
Participation Loan Change Processing and Reporting to Participating Credit Union Automation
Pulling data from the core, this automation compiles and processes loan balance changes and communicates between the lead credit union and all participating credit unions in a participation loan.
Saves 700-2,000 hours
Loan Exception Tracking and Clearing
This automation processes and clears loans within the loan origination system, core, and analytics/ reporting platform that have exceptions due to financial statement and tax returns.
Saves 800-3,000 hours
Loan Input Quality Control (Consumer and/or Commercial)
Run daily, this automation performs quality control on consumer loan booking data from the previous business day across the ticketing, imaging/document management, core, and workflow systems.
Saves: 1,000-3,000 hours
Big Rock 3: How to Standardize and Automate Your Credit Union’s Back Office Operations with Bots and RPA
Boost speed, efficiency, data accuracy, and regulatory compliance while dramatically reducing costs, forever, with robotic process automation or RPA.
While most credit unions have “automated” their back-office operations using industry standard core platforms, those operations are anything but automatic. To the contrary: Despite all the systems and add-ins, they’re a manual-labor, copy-click-and-paste nightmare, like a latter-day Dickens novel.
This isn’t just tragic. It’s wasteful. It puts highly educated (and highly paid) people to work doing mindless repetitive tasks. It saps resources. It invites error. It degrades member experience with delays and errors. And most damagingly, it saps the credit union of operating leverage: the ability to weather peaks and troughs of demand, without the need to increase or reduce staff.
Clearly, robotic process automation, or RPA, is the solution to this back-office backlog. These “robots” are simply software programs that can “sit at a computer,” just like a person, and log into servers, click, copy, paste, format, switch applications, send emails and so on… exactly as a human would. Except robots work infinitely faster than people. They don’t tire, take breaks, or make mistakes.
Imagine, then, the Holy Grail of back-office automation: A “lights-out factory,” with no humans at all, simply humming along. Many real factories achieved this level of automation years ago. Now, credit unions can do the same—or at least strive toward it.
Breaking Down the Credit Union’s Back Office
The back office is any credit union’s lowest-hanging fruit for automation opportunity. In this chapter, we’ll break it down by “buckets,” in terms of both function and bot-enabling benefit.
But you might wonder, “Why aren’t all credit unions today automated already?”
It’s a good question. Indeed, most credit unions which report “bot success” hit a ceiling at only about ten robots, when the average credit union today has opportunities for about 300 robots. Yes: three-hundred! (Maybe more.)
The short answer is that you must first identify the use-cases for bots. These aren’t always obvious. And the use-cases themselves must be bot-friendly. If they’re not, they need to be fixed. Example: Why give a member a free-form text field for an address-change request? Standardize each field in the form, add lock-outs to prevent incomplete submissions, and a bot can sail through it.
At The Lab, we specialize in this kind of work. We’ve patented it. It’s called Knowledge Work Standardization®, and it’s the essential prerequisite for automating your credit union back office. It includes things like cutting through “false complexity”: Some credit unions will have 40 processes for Deposit Ops; others will have 150. The difference? Only the bloated, redundant list of names.
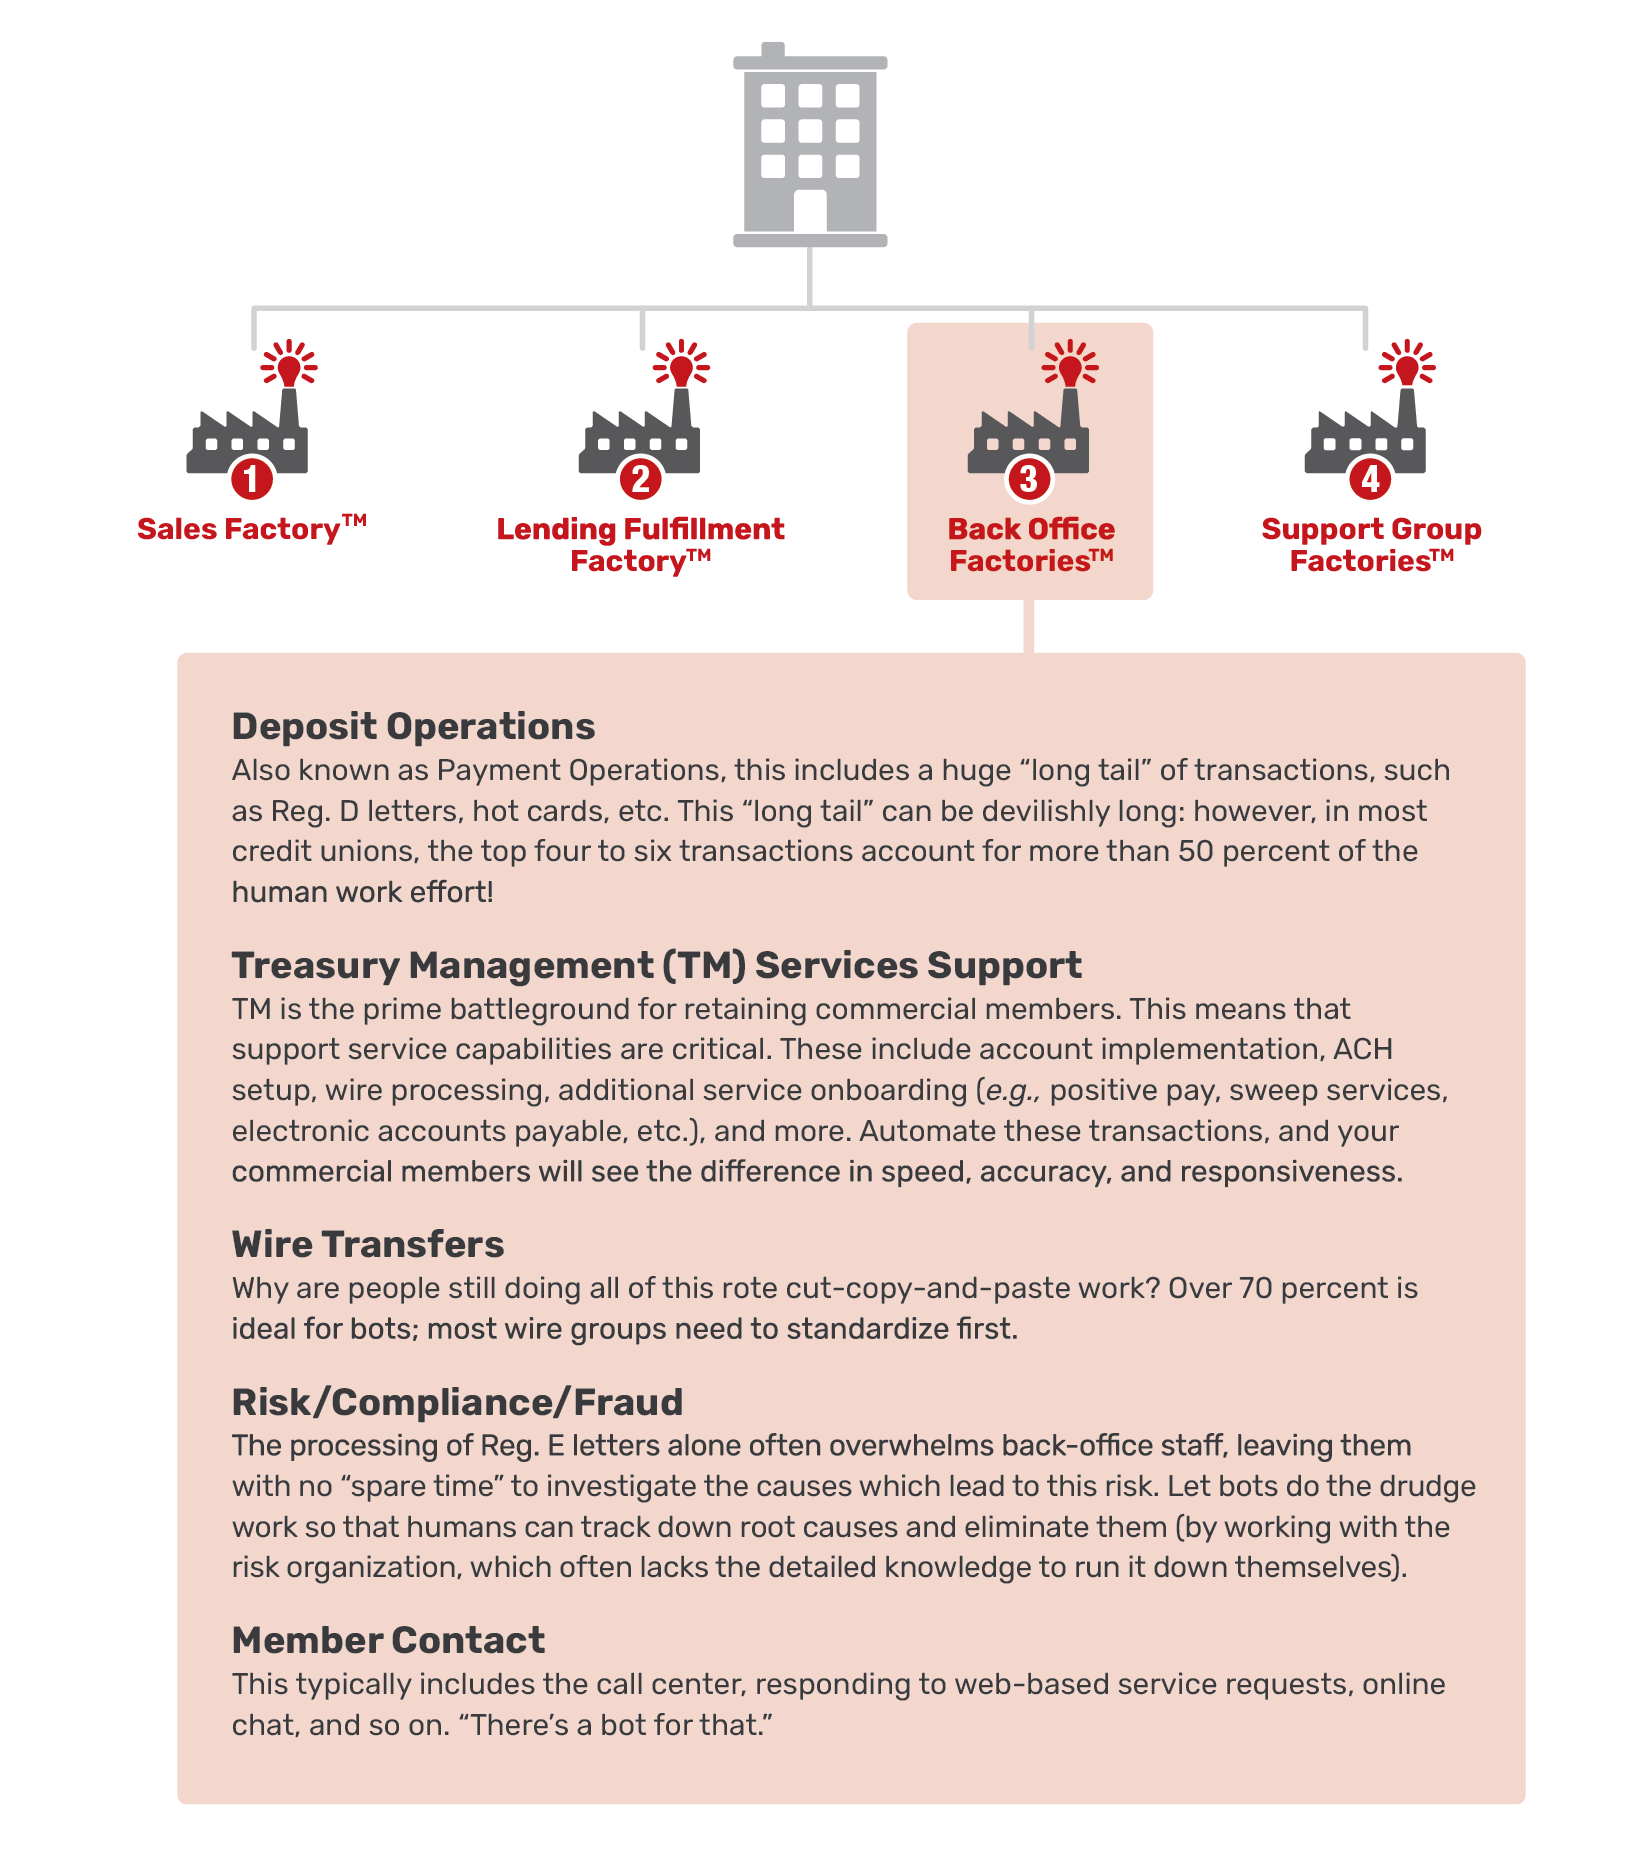
Back-Office Process “Factories” for RPA
Today’s credit union back office resembles a collection of small “factories” that are just begging to be automated. They include:
Breaking Down the Back Office RPA Bots
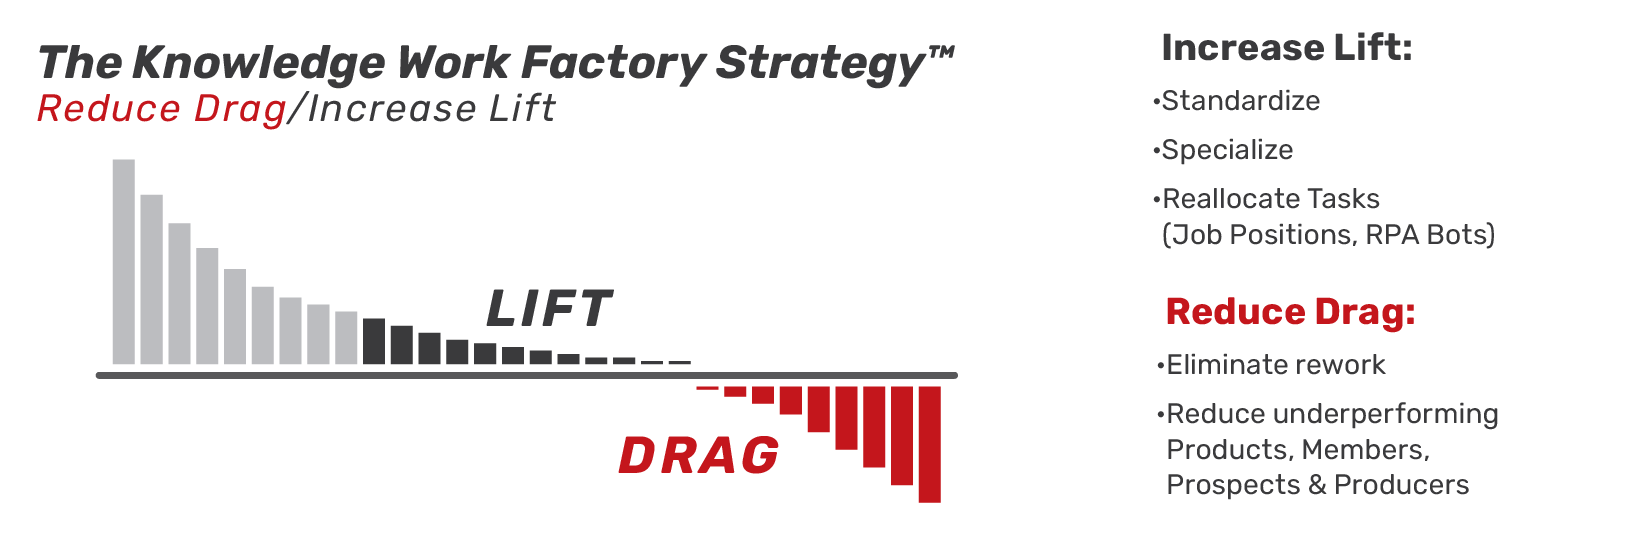
Here, then, are several categories of bots that can boost back-office productivity—increasing productivity “lift” while reducing operational “drag.”
Remember: The average credit union has opportunities for about 300 robots. So, this is just a quick overview to whet your appetite! Be sure to check out The Lab’s handy “Credit Union Robotic Process Automation Shopping List.”
Operating leverage/high-volume bots.
These bots handle work whose volume may fluctuate based on credit union performance (i.e., organic growth), acquisition activity, product development and marketing (e.g., promotions), market conditions, and more. Examples include:
ACH Stop-Payment Bots
For some credit unions, this sit-at-the-computer chore spans four systems that don’t talk to each other. For other credit unions, it’s as many as six. The Lab can implement a bot for any stop-payment protocol.
Debit Card Fraud Processing RPA
One of these bots, installed by The Lab, delivered more than 1,400 hours of employee time and cost savings… in just three weeks!
“Refer-A-Friend” Request Bots
When a promotion like this goes out, input spikes. Why staff up? Why overwhelm existing staff? Simply park a bot on this transaction.
Member experience (CX) bots.
Bots can help differentiate your credit union across four different CX dimensions:
- Speed, e.g., same-day processing
- Product features, e.g., improved account reporting
- Transparency, e.g., proactive status updates
- Service quality, e.g., improved accuracy
Service-Charge Refund Bots
What could possibly make your members happier than getting money they’re owed, faster? At one of The Lab’s credit union clients, this was the highest-transaction-volume category in the entire back office. Let the bot do the drudge-work of reading requests, opening the core system, and making necessary changes.
Business Account Enrollment Bots
The Lab can implement a bot that opens the ticketing system, retrieves new-account-setup requests, extracts the info to Excel, processes it, and opens the new account in the digital credit union system and the core. It then emails stakeholders that the job is complete! All this takes just seconds.
Pre-Approved Account Distribution Bots
Imagine a bot that automates 100 percent of this activity. It can be done; The Lab has done it. It’s an ad-hoc bot, which can be run daily or weekly.
Risk/Compliance Bots.
Bots can easily improve processing speed and accuracy, reduce avoidable follow-ups, and provide data to support sales efforts. They can also provide sales “intelligence” by gathering data and delivering prioritized leads and cross-sell opportunities. Examples include:
Suspicious Activity Report (SAR) Bots
Let a robot handle the data storage and assignment for things like anti-money-laundering (AML) compliance. It does the screen-scraping and Excel-loading, merges it into SQL, and emails a report to stakeholders—daily.
Payment Fraud Processing Bots
A bot can do this easily. At your credit union, processing check deposits that may need extended holds or denials due to concerns flagged by anti-fraud software, requires a ton of work from your beleaguered Deposit Ops staff. But now, you can get more done, faster, while hedging against employee turnover, using RPA bots from The Lab.
Automated SOX System
Access Review Compliance Bots SOX reporting is a nightmare for any credit union. So automate it with RPA bots from The Lab! Check out the below video link to an actual SOX system-identity and access-review bot.
Revenue-Productivity bots.
Bots can easily improve processing speed and accuracy, reduce avoidable follow-ups, and provide data to support sales efforts. They can also provide sales “intelligence” by gathering data and delivering prioritized leads and cross-sell opportunities. Examples include:
“Cash-On-Hand” Bots
Wealth-management sales staff “don’t have the time” to contact members with, say, just $10k in deposits. That’s because they won’t make much money on these accounts. But bots don’t care. They can locate these ripe, low-yield targets and perform the outreach, automatically—at scale.
Online Account Opening Bots
This one bot installed by The Lab eliminates 80 percent of the manual workload for onboarding new accounts online! Not only that, it performs 20 minutes’ worth of human work in just three minutes!
eDeposit Product Setup Bots
Imagine a bot that accesses the credit union’s ticketing system, pulls the right data, reconciles two Excel sheets, processes 13 different steps in the core, updates the ticket, and then emails stakeholders. How can you not want a bot like that?
Too Many Credit Union RPA Bots to List
We could go on. And on. Consider watching videos these of real-life automations recently implemented for credit union clients by The Lab on our YouTube channel.
Cross-Departmental Coordination Bots
This is an entire category of bots that improve communication and visibility between departments to reduce avoidable follow-ups, miscommunication, “slipping through the cracks,” etc. Think of that “Security upgrade from IT that no one knew about and became a back-office nightmare,” or that “Marketing promo which overloaded the contact center because they didn’t know it was coming.”
Reconciliation Bots
It’s a baked-in activity within practically every back-office credit union bot we configure. That’s because every credit union is saddled with “recons”—simply comparing two sets of data, to make sure they match—which takes a staffer hours of work each day. The Lab recently installed 30 “recon bots” at one credit union, which eliminate the drudge work of seven full-time staffers!
AUTOMATE YOUR BACK-OFFICE OPERATIONS TODAY!
Back-office automation isn’t fiction. It’s reality. Best of all, every bot described above can be installed remotely, from The Lab’s U.S. offices in Houston!
The bottom line—engaging The Lab as your credit union process and automation partner to tackle the three Big Rocks yields real financial benefits.
The numbers don’t lie. Following these steps can deliver a massive cost-cutting impact to credit unions. Here are some of the numbers that The Lab has delivered to credit unions:
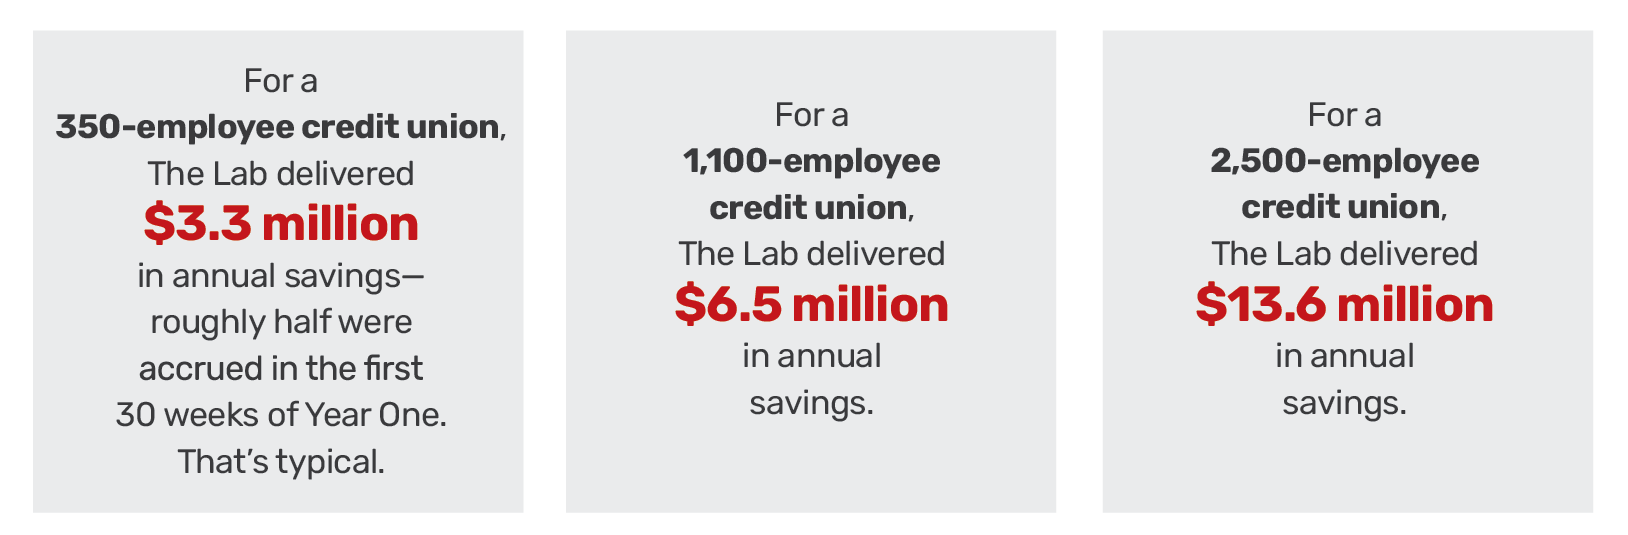
These are real numbers. These are real results.

To transform your branch network and take advantage of this kind of volatility-proofing power, call (201) 526-1200 or email info@thelabconsulting.com to contact The Lab today.
Get a FREE copy of The Lab’s Credit Union Bot Catalog
Find out how to automate what wasn’t automatable when you book your free demo with The Lab!