Advanced analytic visualizations cut costs and outages while improving service
The biggest problem facing any utility, when it comes to vegetation management, is visibility.
To say that this is a “growing” problem is an understatement. Just as trees, vines, and brush grow, so too do the mountains of mitigation efforts, wildfire risk, and paperwork. Consider the challenges:
- You certainly want to improve preventative maintenance. But where are the hot spots? What are the trends? Wouldn’t you love to know where to prioritize your field crews and drone surveys?
- You need to reduce the risk of wildfires and outages—and mitigate the impact of those that do occur. But how can you get a hangle on that from looking at spreadsheets?
- You need to file reports with the state utility commission—a challenge that, like vegetation, never stops growing. But wouldn’t you like to simplify the ability to aggregate your information and create, even automate, that reporting?
These are common challenges. They affect all utilities. Fortunately, there’s also a common solution: Business intelligence or BI. Also known as advanced analytics, it’s a way to take control of vegetation management in ways you never thought possible.
Telescopic and X-ray vision
If you’re new to BI, don’t feel intimidated. To the contrary: Once you see actual BI in action—the kind which The Lab can create for your utility—you’ll feel liberated. It’s everything you’ve always wanted to see, and know, right at your fingertips!
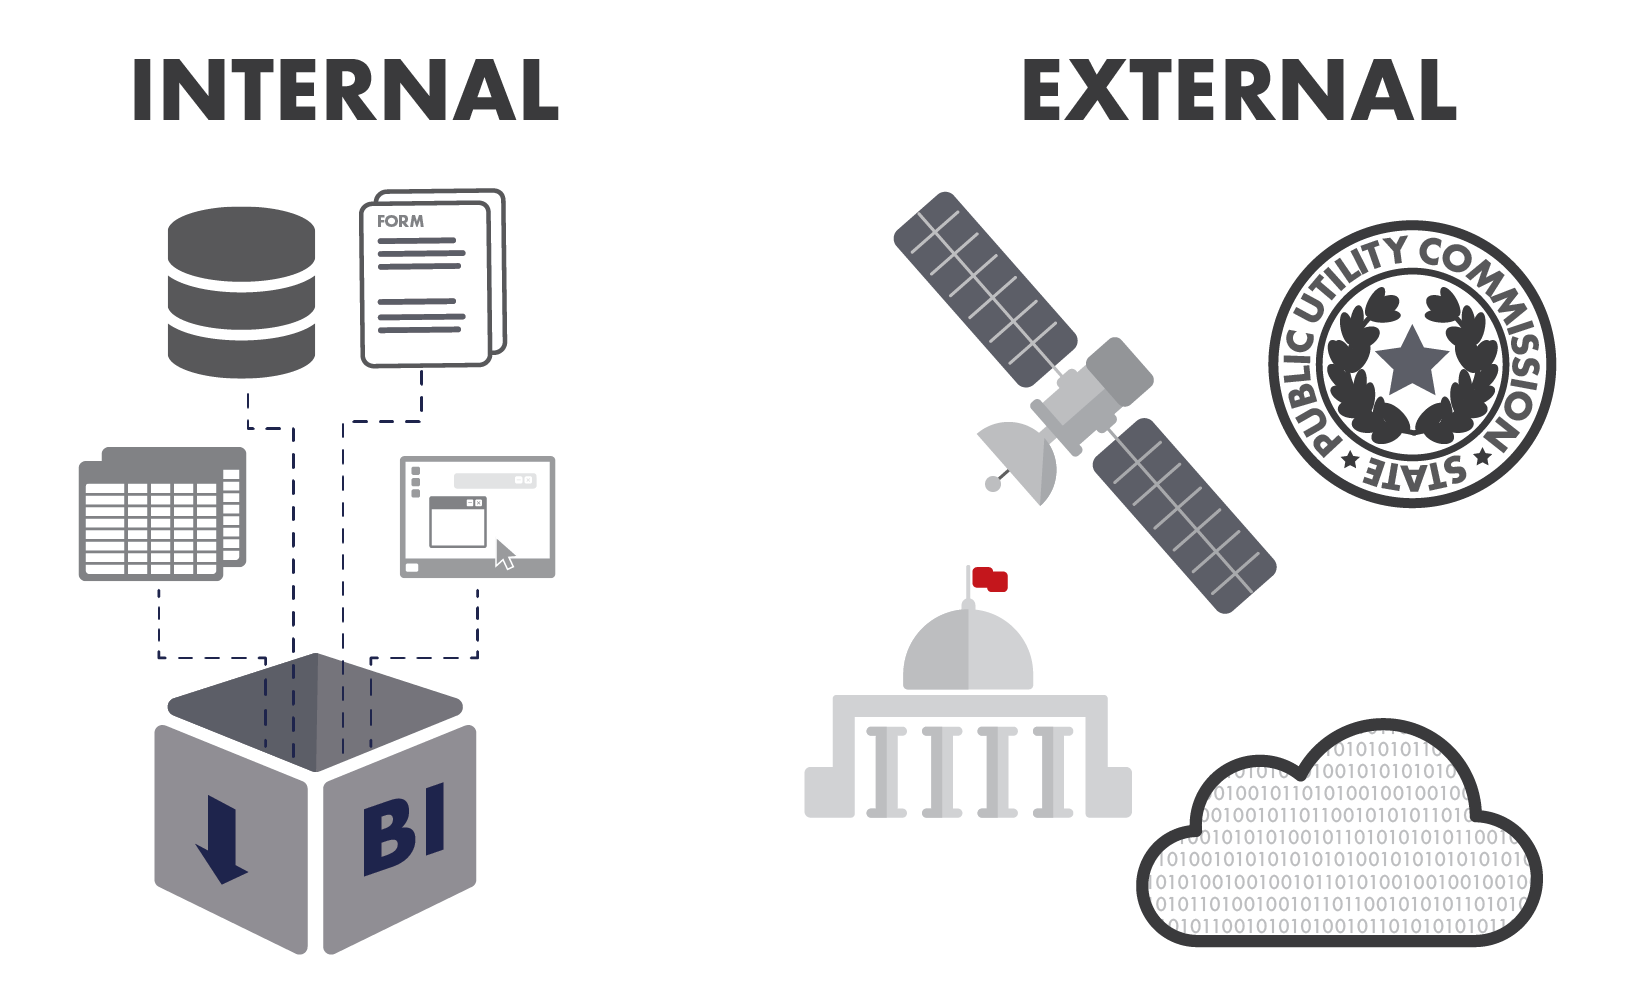
Imagine your utility’s vegetation-management BI as your own private web page, which you can access from any computer, tablet or phone. It takes tons of data, from a virtually unlimited array of sources, and crunches it all together to make an instantly-readable graphic depiction of what’s happening.
It’s one thing to read about BI. It’s another to see it in action. Check out the two-minute video about BI for utilities vegetation management, which The Lab has created:
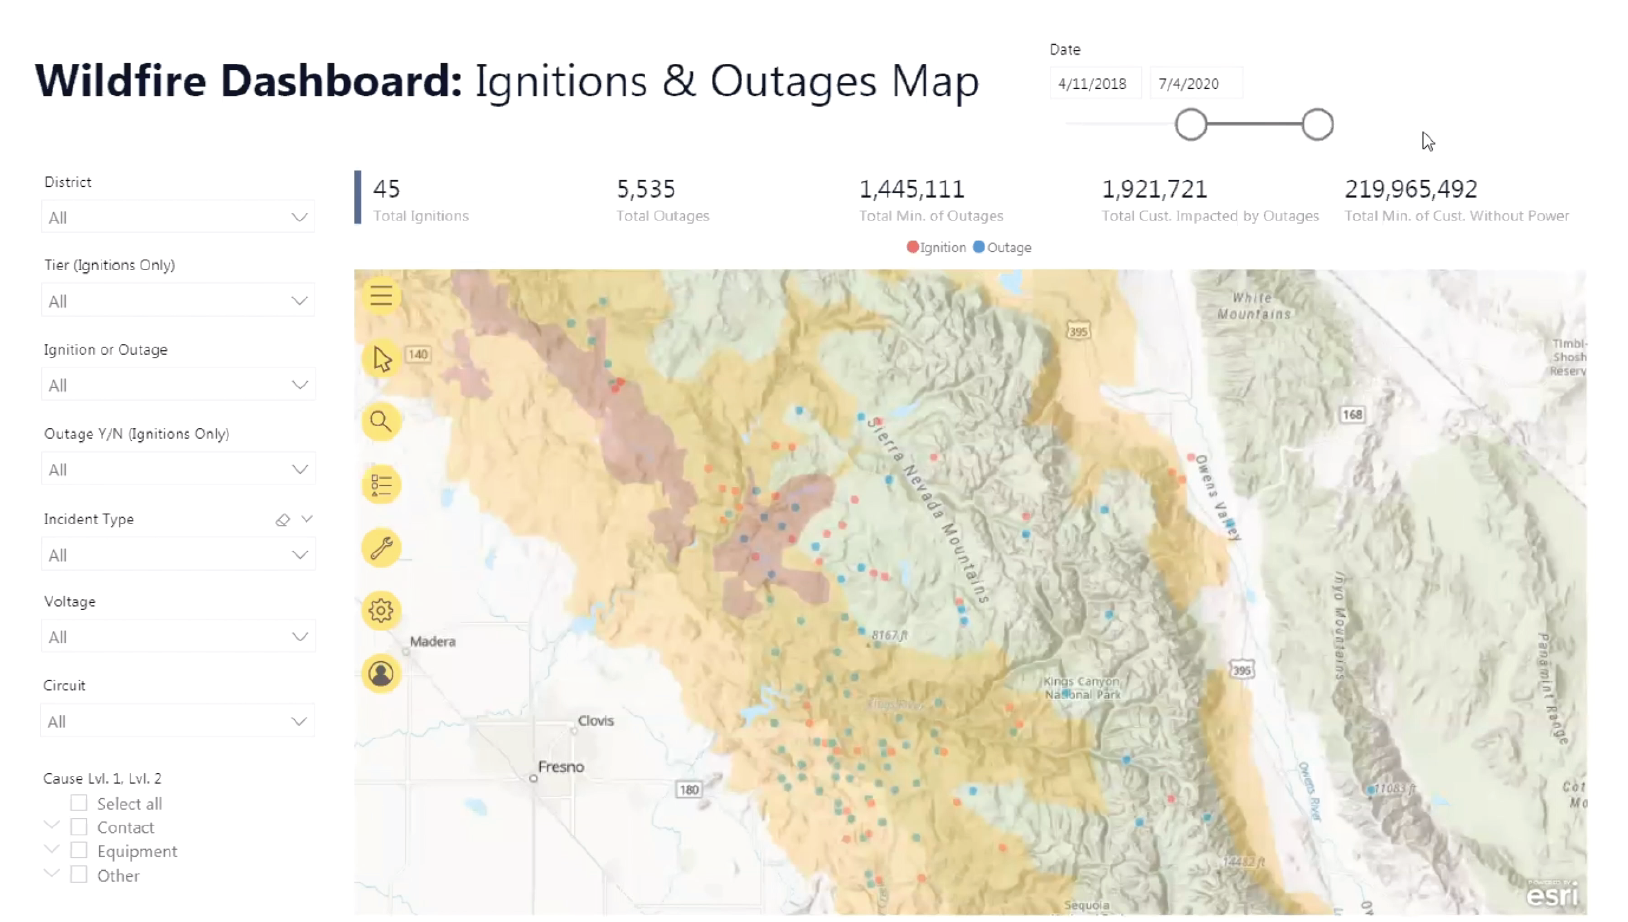
One of the most exciting things about BI is that it’s not static. It’s dynamic. Sure, it’s amazing to see trends at a glance. But it’s so much more powerful than that. Like your own private dashboard, it’s equipped with a quick-glance overview, indicated by a row of numbers across the top, such as those found on an “Ignitions and Outages” BI:
- Total ignitions
- Total outages
- Total minutes of outages
- Total customers impacted by outages
- Total minutes of customers without power
Again, that’s what you’ll see at first glance. But it gets much more exciting when you realize that there are intuitive sliders and filters that you can click, for Amazon-like ease of use. So you can set the specific date range you like. And you can filter for factors such as:
- District
- Incident type
- Voltage
- Circuit
- Cause
Where, incidentally, is all this information coming from? You’ll be pleasantly surprised to learn that it’s coming not just from your own internal data, but also external data which it can pull from the state utility commission, satellite mapping agencies, and more.
This makes is possible for The Lab to create an “ignitions and outages” BI which looks like an actual map of your service area. We can import a real map, and program the BI to overlay your actual ignitions and outages—even color-coding them for easy view. In this view, for example, you’ll see that “Ignitions” are red dots, while “Outages” are blue dots:
It gets better. You can zoom in or out, just as you do on Google Maps. And if you simply hover your mouse over any one of those dots, you’ll get a detailed pop-up showing:
- Latitude
- Longitude
- Incident type
- District
- Cause
- Total customers impacted
It looks like this:
Park some bots on it, too
You might think that the power of BI ends with BI. But it doesn’t. Once you have all of this data, properly standardized with some help from The Lab, we can “park some bots” on it to automate many of the manual, sit-at-the-computer activities that your knowledge workers, well, hate doing. Let bots import data into reports for the state utility commission. Let them process job sheets from contract line workers. Let them “read” the BI, and email you a morning update of just the key points. If it involves mindless, tedious, repetitive, detail-laden, error-prone computer work, it’s ideal for robots.
It’s one thing to read about BI and robotic process automation for utility vegetation management. It’s another thing, entirely, to see it in action, in a real, live demo. So get one! The Lab invites you to schedule your own, no-obligation 30-minute screen-share demo, in which we’ll show you all this power at work, and answer any questions you may have. Best of all, you’ll see how we’re able to do all of this remotely from our U.S. offices in Houston. Simply call (201) 526-1200 or email info@thelabconsulting.com to book your demo today!