


Situation
This packaging manufacturing company’s most popular products—paperboard and corrugated boxes—were historically the low-price leaders and their customers included
many of the world’s most recognized consumer brands. But now some of these customers—across a complex network of wholesalers, manufacturers, and converters—were complaining about the “total costs” of doing business with the company.
They pointed out clunky ordering interfaces, pricing errors, split shipments, and more. Issues at every step caused customers to carry higher packaging “buffer” inventories, perform rework, request returns, and haggle over credits. Surprisingly, larger customers with national or global networks complained about the lack of consistency—service levels, terms, options, inventories, even forms—across product lines, business units, and locations.
Higher-priced competitors, guaranteeing smoother, customer-tailored service levels, were beginning to make inroads. They were “stealing” customers by demonstrating the tangible, measurable benefits that their superior performance could make for their customers’ total cost of doing business with them. They specifically promoted their consistency with a “one face to the customer” message.
These customer defections attracted the attention of the company’s Chief Marketing Officer (CMO). She was relatively new to the company—two years—and had never worked in the industry.
She informally interviewed every group along the company’s value chain, from sales through manufacturing, delivery, billing, and customer support. She discovered diverse, uncoordinated efforts to respond to this competitive incursion.
The company’s head of technical operations was responding with classic lean manufacturing improvements and selected production equipment upgrades. Customer Service ordered a new upgrade for their call-processing system. The sales organization struggled to understand how its recently-deployed customer relationship management (CRM) application could help.
The CMO was struck by how differently everyone within the company perceived the objectives of their individual improvement efforts. Nobody was focused directly on consistency or responding to the challenge of presenting “one face to the customer.”
At the next executive leadership team meeting, the CMO highlighted the unaddressed threat posed by continued inconsistency across the business. The team decided to contact The Lab to document and assess the potential benefits available from increasing standardization to improve consistency—and help internal teams “automate it into
business operations.”
Client Description, Project Scope, Objectives
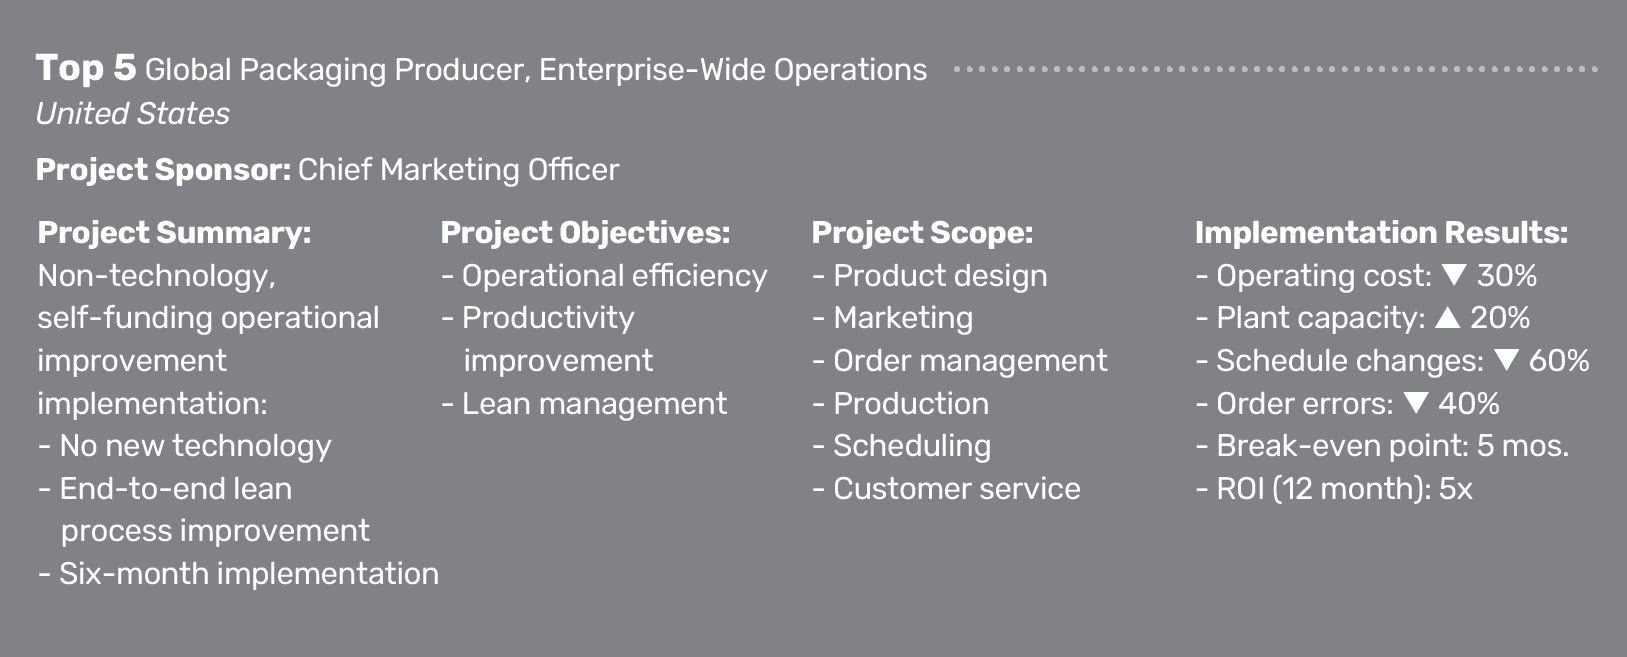
The company is a global Top 5 producer of paper and fiber packaging products with over 20,000 employees. Like most peers, growth was achieved through mergers and acquisitions over a period of decades. Although the business entities have long been integrated, the degree of operations integration—and consistency—varied widely
across all aspects of the business, from the plant floor to the chart of accounts in finance.
The project scope included documentation and assessment of the entire value chain of the business: marketing, sales, order management, customer support, engineering,
plant scheduling, and all aspects of production and distribution.
The initiative primarily targeted discovery and documentation of opportunities to increase the current levels of standardization for everything large and small, customer-facing and internally focused: products, services, business processes, performance measures, and more.
A secondary objective included identification of work activities that could be automated by the company’s existing Center of Excellence (COE) with newer digital technologies that required little or no change to existing major IT systems. Although most of these newer technologies were already in use at the company, progress had been stalled by a struggle to identify practical, valuable “use cases,” or automation opportunities.
Overview: Phase I, Analysis and Discovery
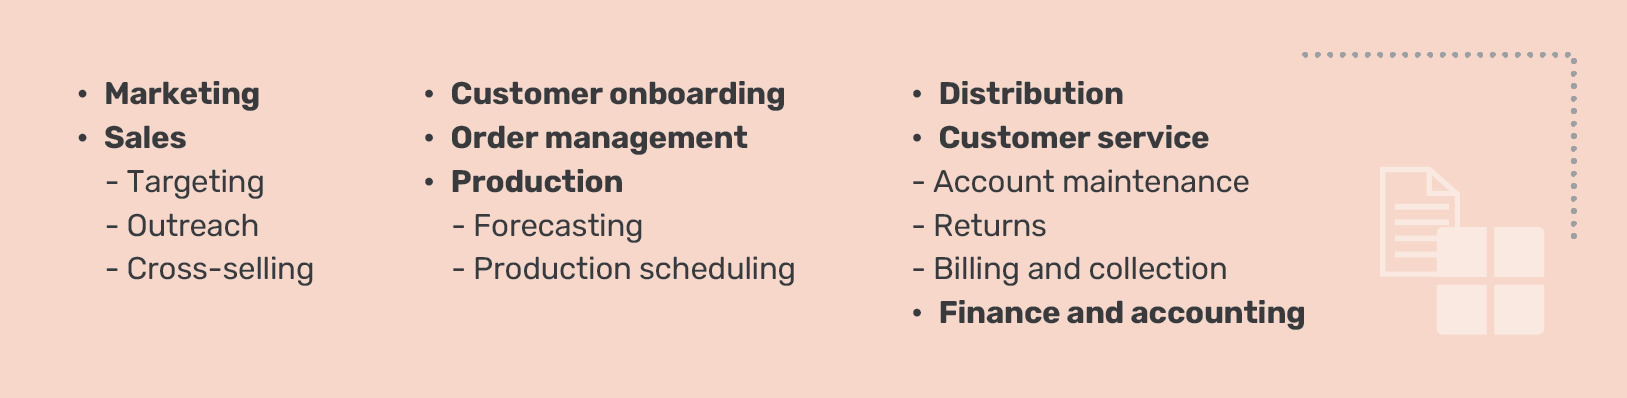
The initiative began with an eight-week Phase I analysis covering the major end-to-end business processes, including:
The Lab’s database of standardized documentation tools, called Structured Analytical Templates™ or SATs, enabled rapid comparison and assessment of the client’s current-state, enterprise-wide operations—from sales and marketing through manufacturing and distribution. These SATs cover organizations and end-to-end business processes. Detailed documentation includes:
• Industry-standard key performance
indicators (KPIs)
• Related data elements, data structures
(taxonomies)
• Performance benchmarks
• Best practices
• Automation “use-cases”
• And more
The SAT comparisons enabled rapid, remote documentation and analysis of more than 85 percent of employee work activities (approximately two minutes each). This pre-structured approach saves time, typically requiring one hour per week of participation by client subject matter experts (SMEs).
To rapidly and cost-effectively cover the broad global scope, The Lab and the client management team jointly developed a “frugal analytical footprint.” Representative products, customers, locations, and markets were selected for in-depth documentation and analysis. The results from these efforts were then tested against a larger set of locations to assess exceptions and create high-confidence, enterprise-wide findings estimates.
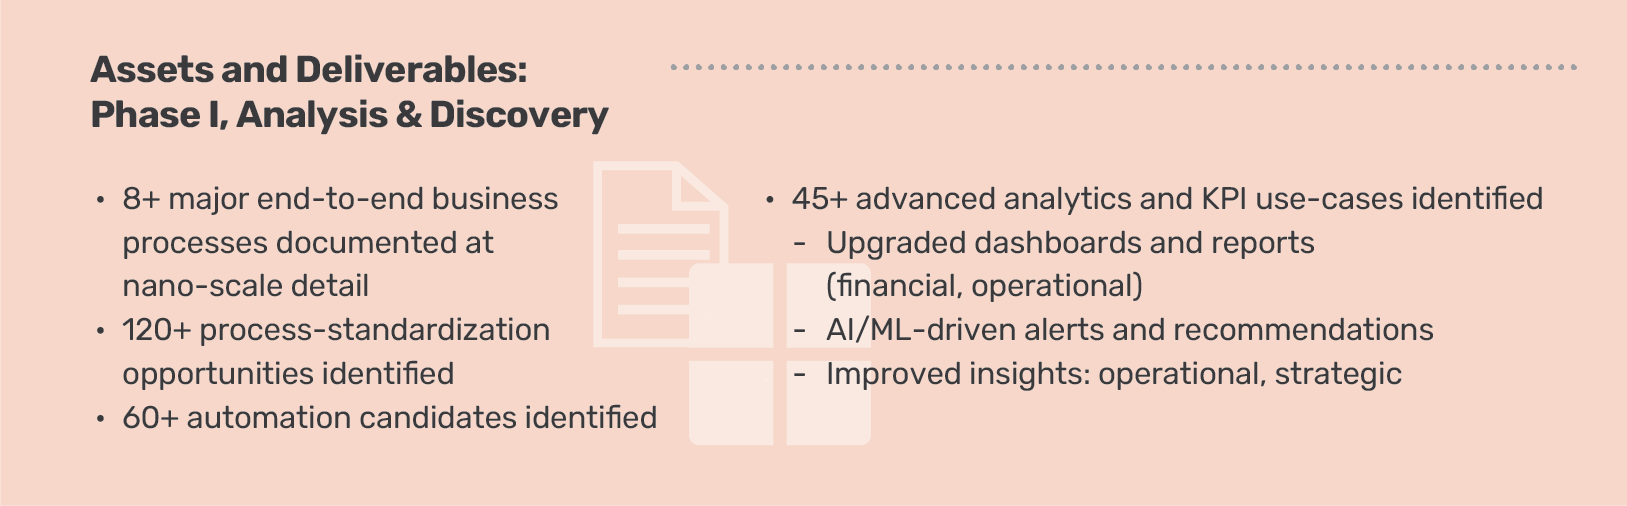
During the Phase I analytical effort, The Lab identified over 200 improvements. About 60 percent of these represented nontechnology standardizations to improve
operational effectiveness, reduce avoidable rework, and/or enable automation.
Roughly half the other, technology dependent improvements were automated with existing technology after the work was standardized. The remainder relied on robotic process automation (RPA), and small, low-code applications (e.g., automated forms, onboarding apps, etc.).
Most of the necessary technologies were already deployed in the business. Many could be further augmented with artificial intelligence (AI) for simple decision-making
and proactive, real-time notifications.
Better yet, all improvements could begin implementation immediately and incrementally, without the risk of a “big bang” event.
Findings: Phase I, Analysis and Discovery
More than 200 improvements were documented during the eight-week Phase I work effort. These were grouped into three major improvement themes designed to standardize work activities, provide insights to improve profitability, increase the use of existing technology, and implement valuable automations.
“Mis-categorized” customers. The company determines the terms, conditions, and service levels provided to customers based on traditional industry categorizations such as manufacturers, wholesale distributors, and converters.
However, these traditional categorizations do not necessarily reflect the needs of these customers: product characteristics, minimum order size, freight mode, and credit requirements. For example, all converters are allowed to buy direct, but actual order load sizes vary from train cars to pickup trucks across different converters.
“Hidden” plant capacity. Multiple, overlooked factors resulted in schedules and plant/product allocations that diminished available plant capacity—even before more obvious daily “hold-everything” schedule changes further reduced production throughput.
In scheduling, for example, many individuals could insert “adjustments,” with minimal visibility and accountability for the reductions that invariably resulted.
And production volume was allocated evenly across the plant network based on “fairness” to plant managers, despite the fact that uneven (“unfair”) allocations, based on machine-level productivity, could deliver significantly increased network productivity.
Micro-inconsistencies. Close scrutiny of business processes revealed hundreds of activity-level (two-minute task duration, or less), avoidable inconsistencies.
For example, numerous devices across the organization—from the customer contact-center apps to the plant-floor production machines—included on-screen “free
text” input fields instead of standardized, multiple-choice input options. A single issue would be described in dozens of different ways:
• “Photo eye broken”
• “Broken photo eye”
• “Dirty photo eye”
• “Broken sensor eye”
• Multiple others
Overview: Phase II, Implementation
A six-month, self-funding, enterprise-wide Phase II implementation reduced the “total cost” of doing business with the company and fulfilled the promise of “one face to
the customer.”
Improvements were implemented without any “big-bang” events or disruption to production.
Standardization improvements
• Preempted schedule changes at plants
• Reduced avoidable rework associated with inconsistent business processes across locations
Automation and advanced analytics dashboards:
• Tied together incompatible systems
• Converted data from disparate sources into a standard format
• Centralized in a “master” data repository of:
– Customers
– Products
– Markets
• This also provided a single, internal “view of the customer,” strategically designed to support more effective efforts:
– Cross-selling
– Up-selling
– Servicing
– Margin-management
Paper and Packaging Improvement Examples: Phase II, Implementation
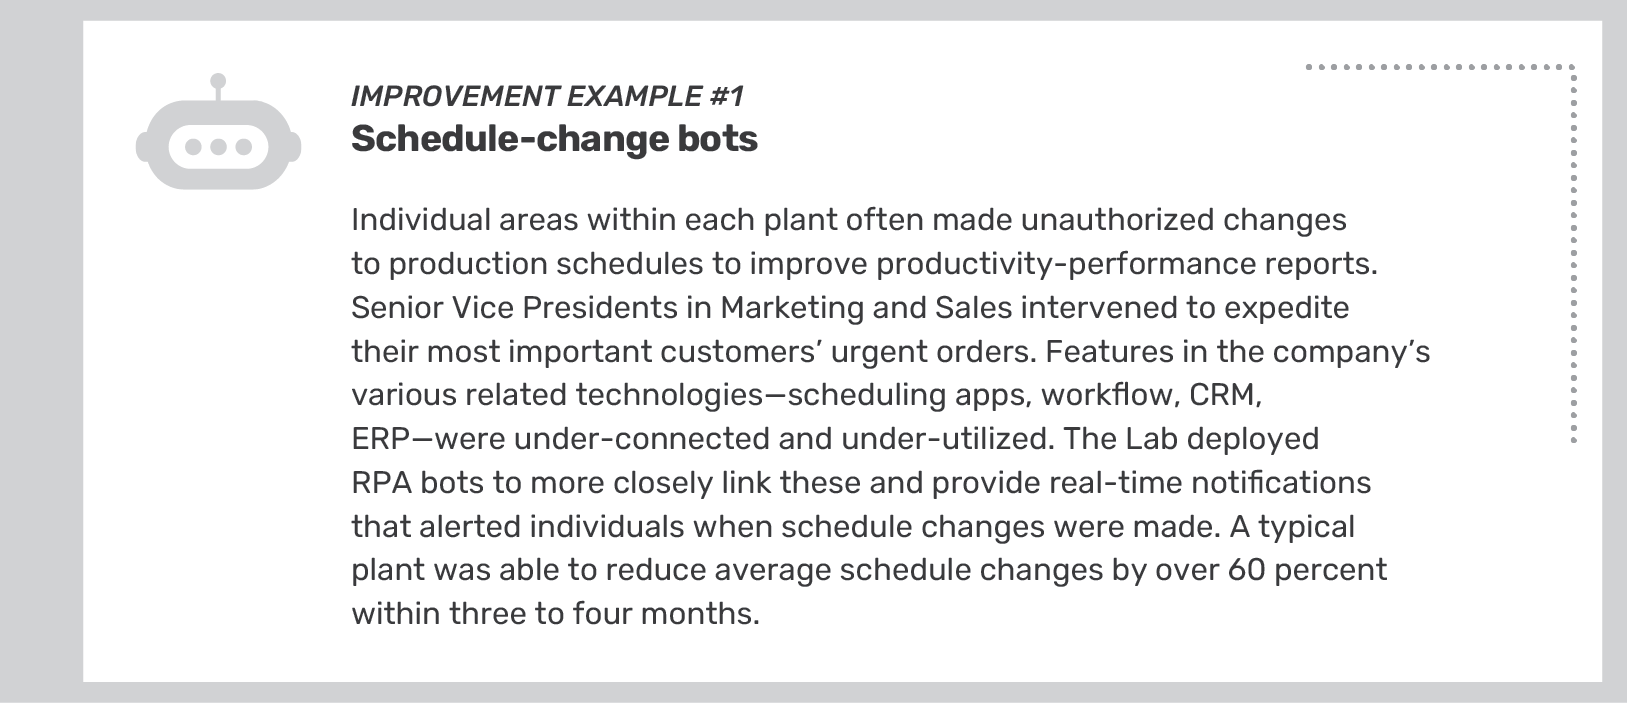
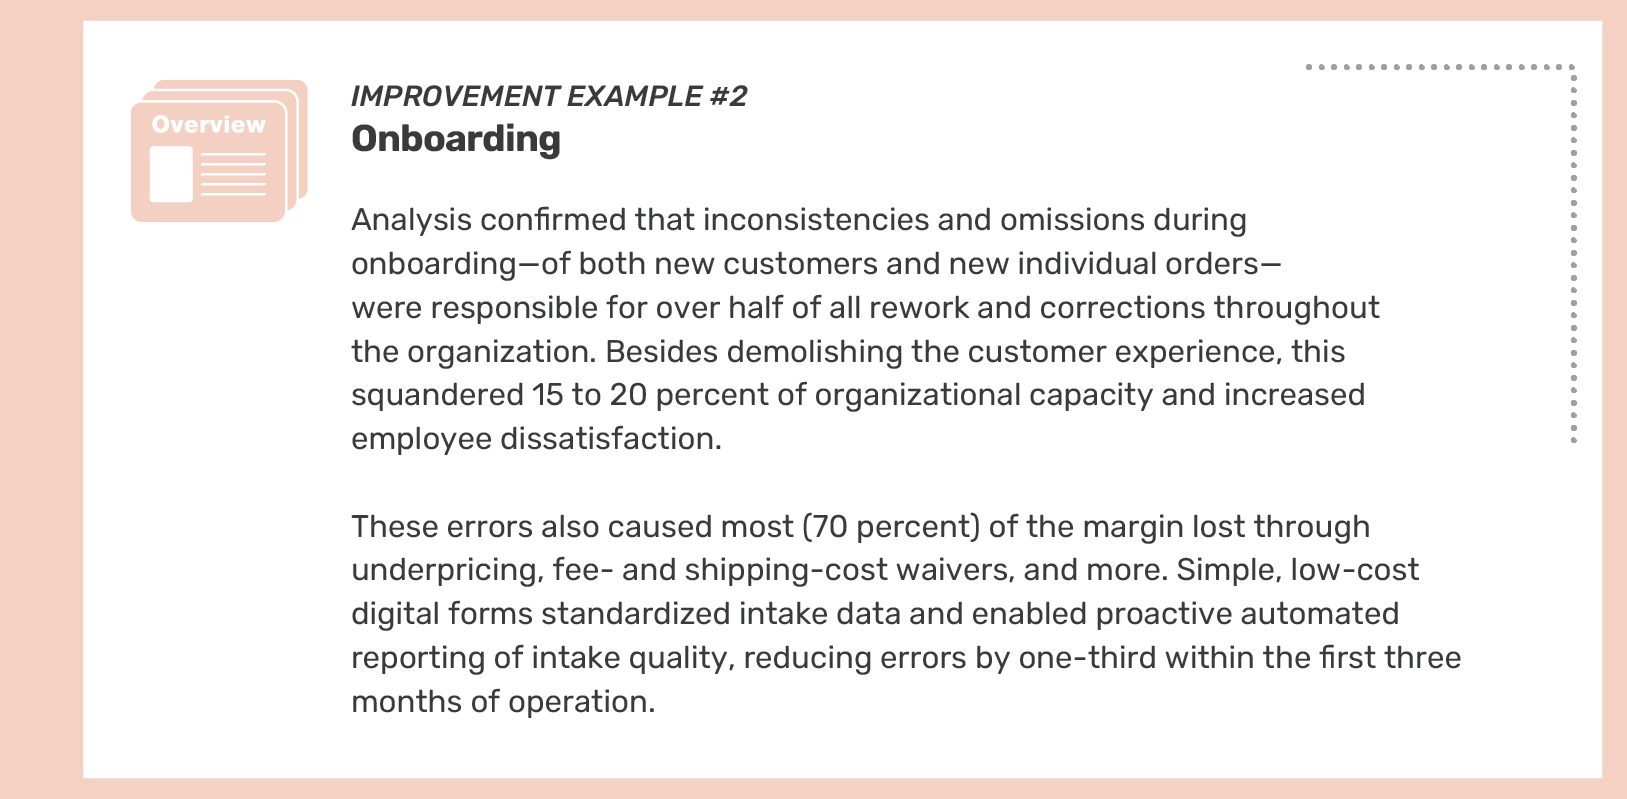
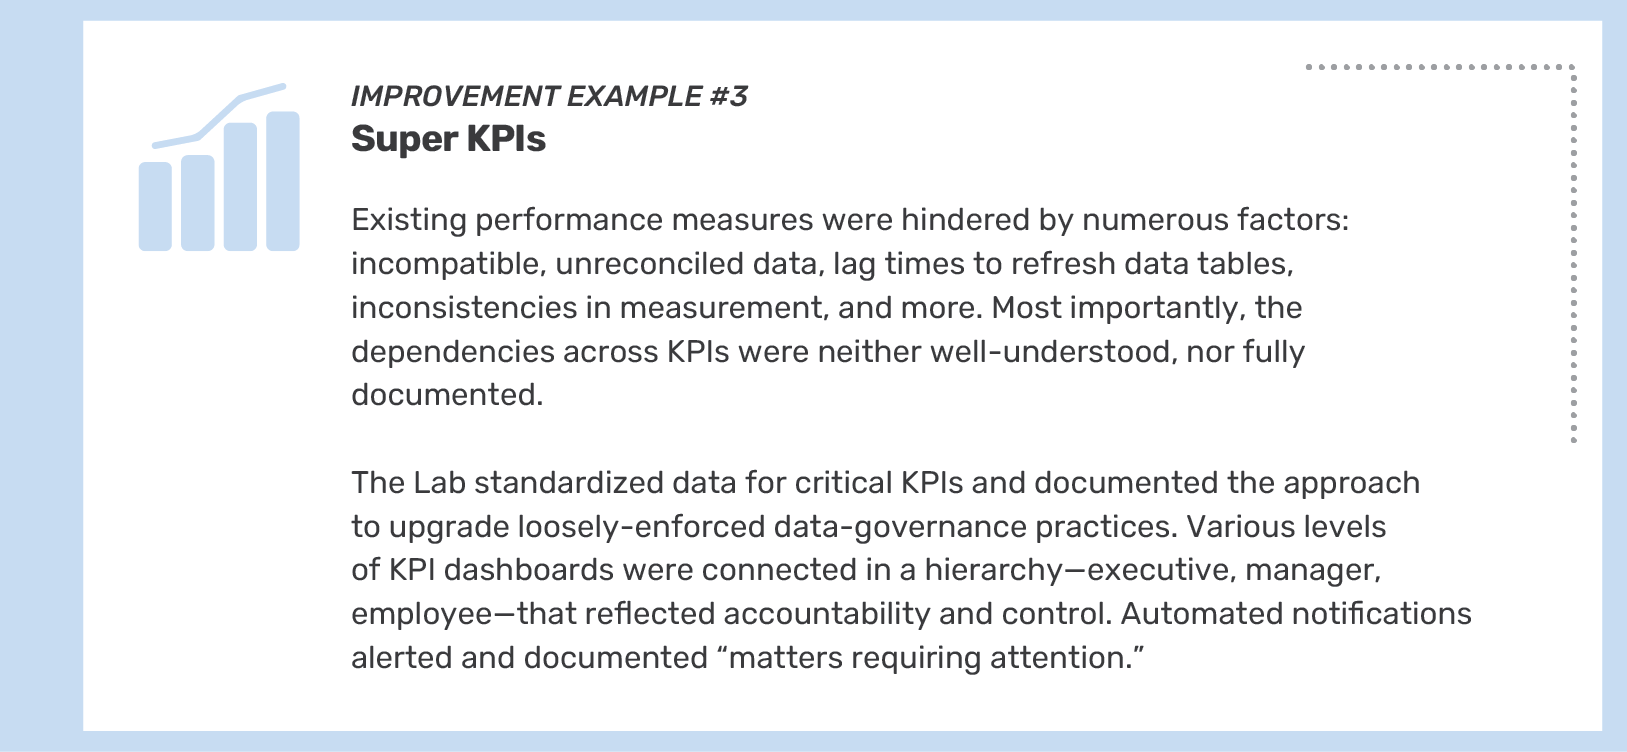
The Lab implemented more than 100 non-technology process improvements and best practices. Related improvements were organized into major implementation work streams, including the three examples below.
Post-Implementation Support, Sustainability & Automation
The Lab provided hassle-free, post-implementation hourly sustainability support for this client to maintain automations, process standardization, and operational data analytics models implemented during the Phase II engagement.
If the client’s team was not up-skilled enough to perform any needed automation updates, they leaned on The Lab for Tier 3-level support. If analytics dashboards required additional views or data connected, The Lab’s team was a simple phone call away.
The Lab Makes it Easy
Organization-friendly engagement design
At The Lab, we’ve spent three decades refining every aspect of our transformation engagement model. We’ve made it easy for clients—from the C-Suite to the front line—to understand and manage the initiative:
• Minimal use of client time: One to two hours each week, maximum.
• Measurable benefits: Typical 12-month ROI is 3x to 5x.
• Pre-built templates and tools: Process maps, data models, bots, and more.
• U.S.-based, remote delivery: Nothing is ever outsourced or offshored.
Designed to reduce risk, increase success
Since 1993, The Lab has led the industry in eliminating risk for our clients. Whether your engagement involves a handful of bots or wall-to-wall transformation, we make it easy to do business with us:
• Fixed pricing and clearly defined scope
• Pre-project feasibility/value assessments at nominal cost
• Early-out checkpoints and options
• Money-back guarantees
Book your free demo
The best way to learn about The Lab’s patented Knowledge Work Standardization® approach is to book your free, no-obligation 30-minute screen-sharing demo. And you’ll get all your questions answered by our friendly experts. Simply call (201) 526-1200 or email info@thelabconsulting.com to book your demo today!