


Lean Customer Service Process Transformation for Medical Devices
For years, the product-return volumes for this company’s medical devices grew predictably and proportionately with sales by region. Managing returns and related compliance was relatively simple for each region and product line. But over the course of several years, the unpredictability of these returns soared—and was still growing. The total returned goods volumes were in line with industry norms, but it became almost impossible to complete processing while meeting the regulatory cycle times and documentation requirements.
Despite the company’s numerous “standard operating procedures” (SOPs), each of its three global returns processing centers handled their assignment somewhat differently. There were variations across products, regions, and sometimes even across different employees in the same location. These inconsistencies thwarted the company’s desire to centrally triage returned goods processing across locations, balance all available processing capacity, and keep cycle times within regulatory limits.
Attempting to solve the problem, the company invested heavily in a cloud-based Returns Management Application or RMA. As initially installed, the technology was cumbersome to use. Employees disliked keying in the extensive data and status updates required. They felt that these added tasks simply slowed them down.
Cycle times eventually exceeded the industry average by nearly double, and sometimes more. Compliance violations (read: “financial liability exposure”) skyrocketed. Customer experience declined. Returned goods processing costs increased sharply. None of this was helping to position the company to achieve its aggressive growth strategy targets.
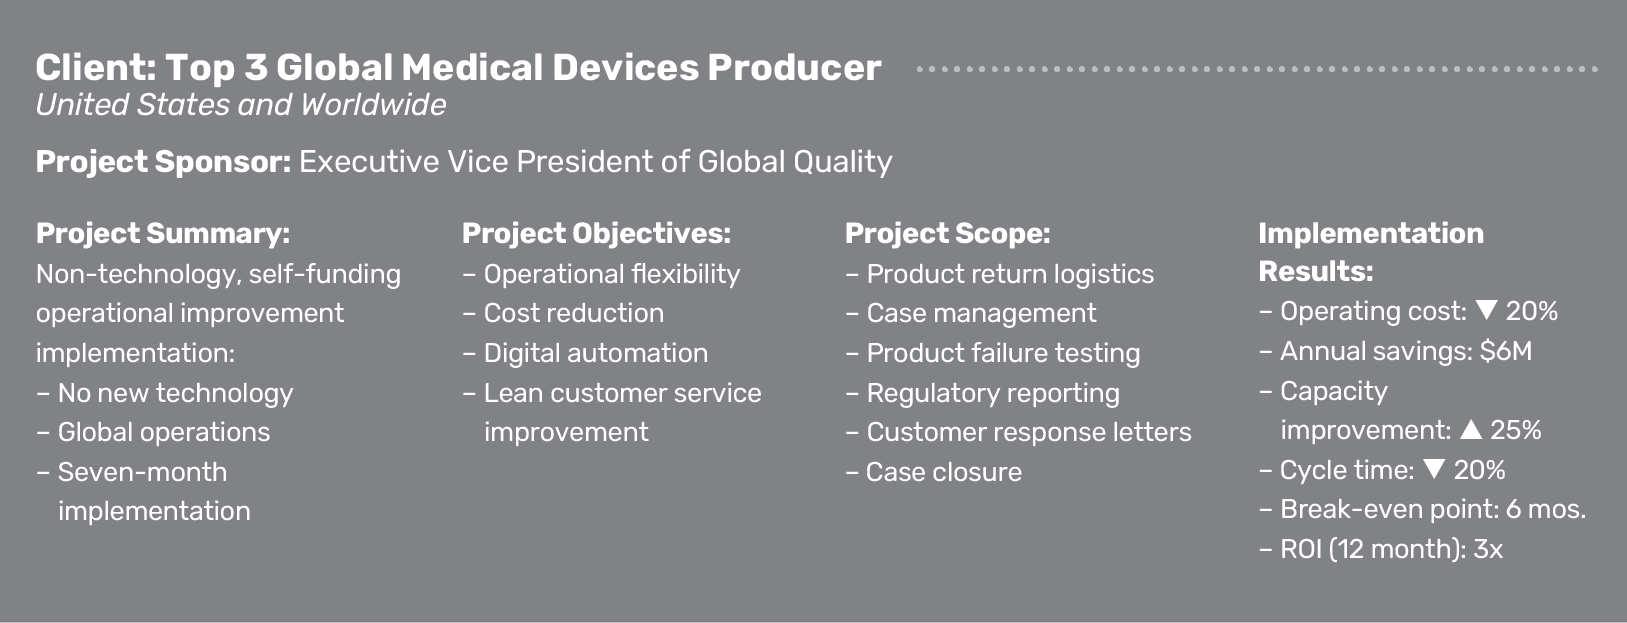
Client Description, Project Scope, Objectives
This global top-ten medical-device subsidiary maintains 20 facilities for operations and manufacturing. It sells & services products in over 100 countries. Product return operations included 450 employees in three global locations.
The principal objective was to develop a broad, inarguable consensus on the existing returns-processing operations including returns routing decisions. The documentation
developed would include comparative process maps, reliable data on actual “touch time” versus cycle elapsed time, slow cycle times, and administrative quality. Specifically, this company had to get past the predictable finger-pointing between the various entities involved throughout the typical returns life-cycle:
• Sales/Customer support
• Engineering
• Production
• The returns group
The company wasn’t unwilling to change; nor did they lack the budget to make changes, as their hefty RMA investment made clear. They were, simply, gridlocked and
frustrated with prior, disappointing efforts. They wanted to pinpoint the problems, smooth out the variance, and make better use of their three state-of-the-art returned-goods processing centers.
The Lab’s database of standardization & improvement templates convinced management it was possible.
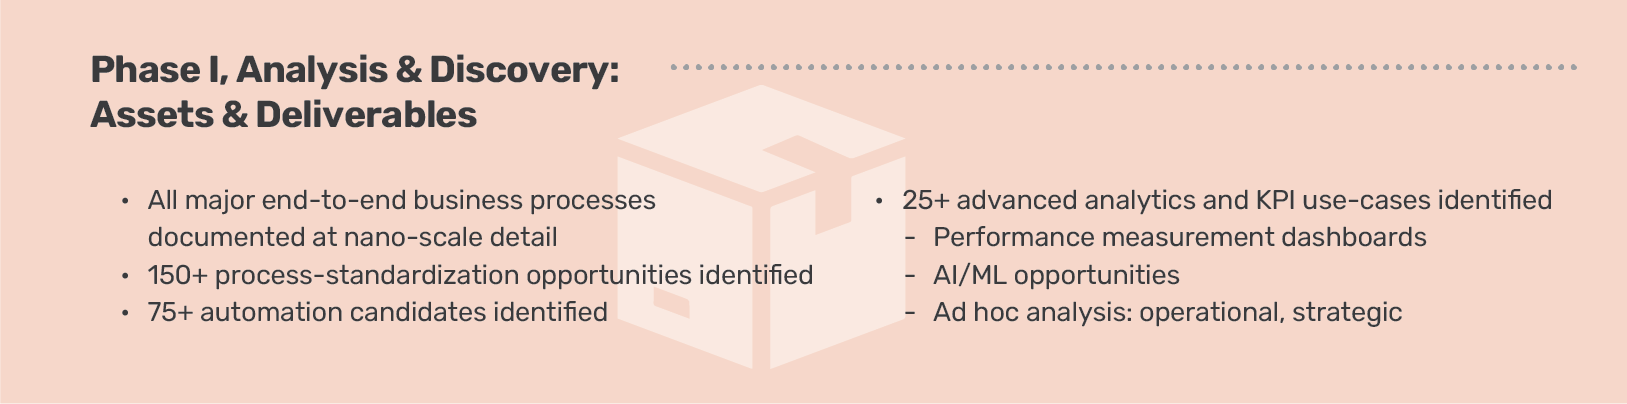
Phase I, Analysis and Discovery
The Returned Goods & Warranty (RGW) transformation initiative began with an eight-week, Phase I analysis. It documented the end-to-end (E2E) business processes from annual returns planning to individual product authorization and shipping, including the hand-off to the appropriate parties within the business, including Repairs, Replacements, and Compliance/Legal.
The Lab’s standardized process-map and discovery templates enabled documentation of more than 85 percent of work activities (approximately two minutes each, or less), while only requiring one hour per week of any subject matter expert’s (SME’s) time.
The Lab’s advanced analytics models mined, compiled, and generated insights for the maps from internal client data: event logs, org charts, volumes, cost-center data, and much more. The Lab’s external data provided benchmark comparisons, best-practice comparisons, and automation use-case comparisons.
Coordinating and reconciling the internal data and external benchmarks across three regions resulted in E2E maps that could easily be directly reviewed, refined, and validated by all 450 employees—even with the company’s far-flung locations across the globe.
This Phase I effort delivered a self-funding business case and work plan that launched an eight-month, Phase II transformation project that implemented the recommendations and findings from Phase I.
The improved performance (detailed in the Phase II description below) was achieved with robotic process automation (RPA), workflow automation (minimal), and more effective and extensive use of the previously installed RMA platform.
Phase I findings
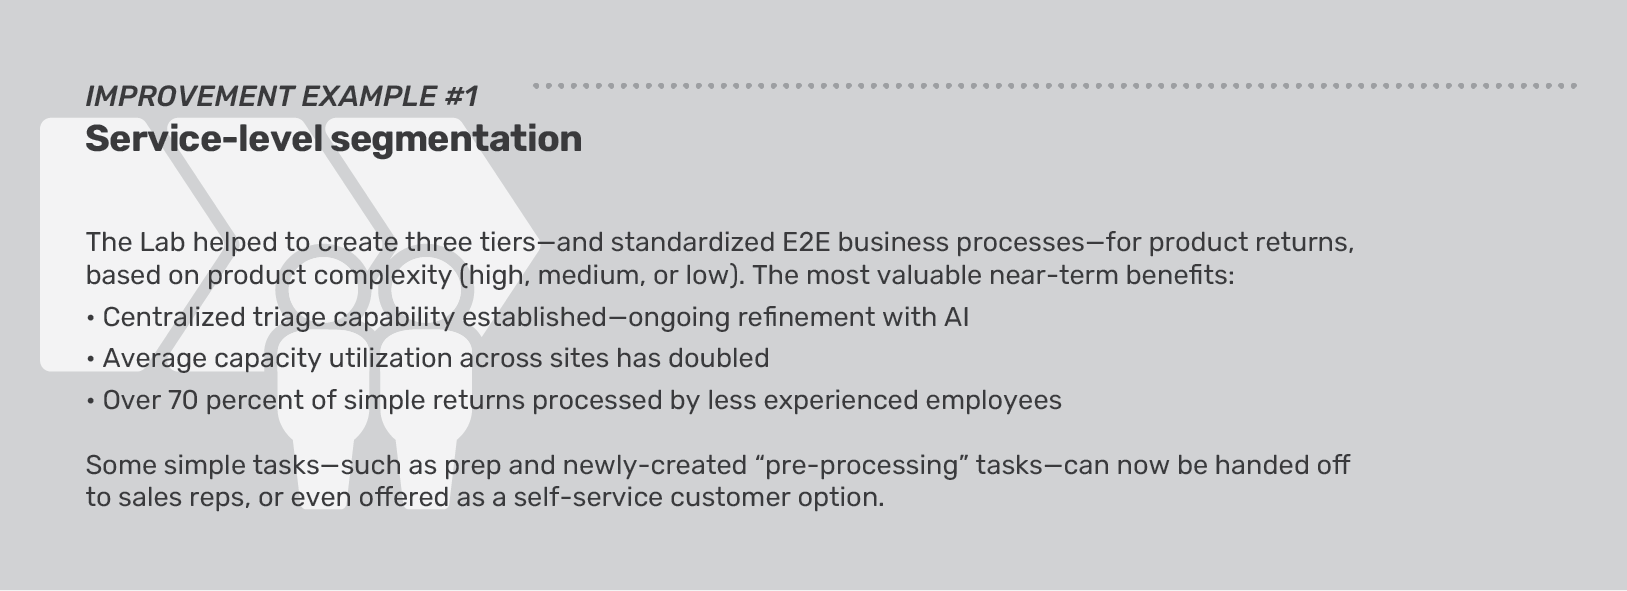
The Lab’s analysis revealed that the returns process needed to be divided into three buckets, depending upon the complexity of the device being returned: low, medium, and high. The low end dealt with simpler (yet higher volume) products such as catheter tubes, whereas the high end was dedicated to more complicated, lower volume
(yet higher compliance/liability/risk-exposure) products such as heart pacemakers.
This segmentation, aligned with individual-employee skill levels, solved the disparity and delay of having “over-qualified” technicians handling simple, higher-volume product returns that could be processed by less experienced employees.
The findings also revealed the need to standardize processes and activities across the different locations, to realize the goal of transferability and enable a central point of triage and capacity management for all returns.
Phase II, Implementation
The eight-month, self-funding Phase II implementation effort was able to increase productivity, compress cycle times, improve customer service, and deliver cost reduction.
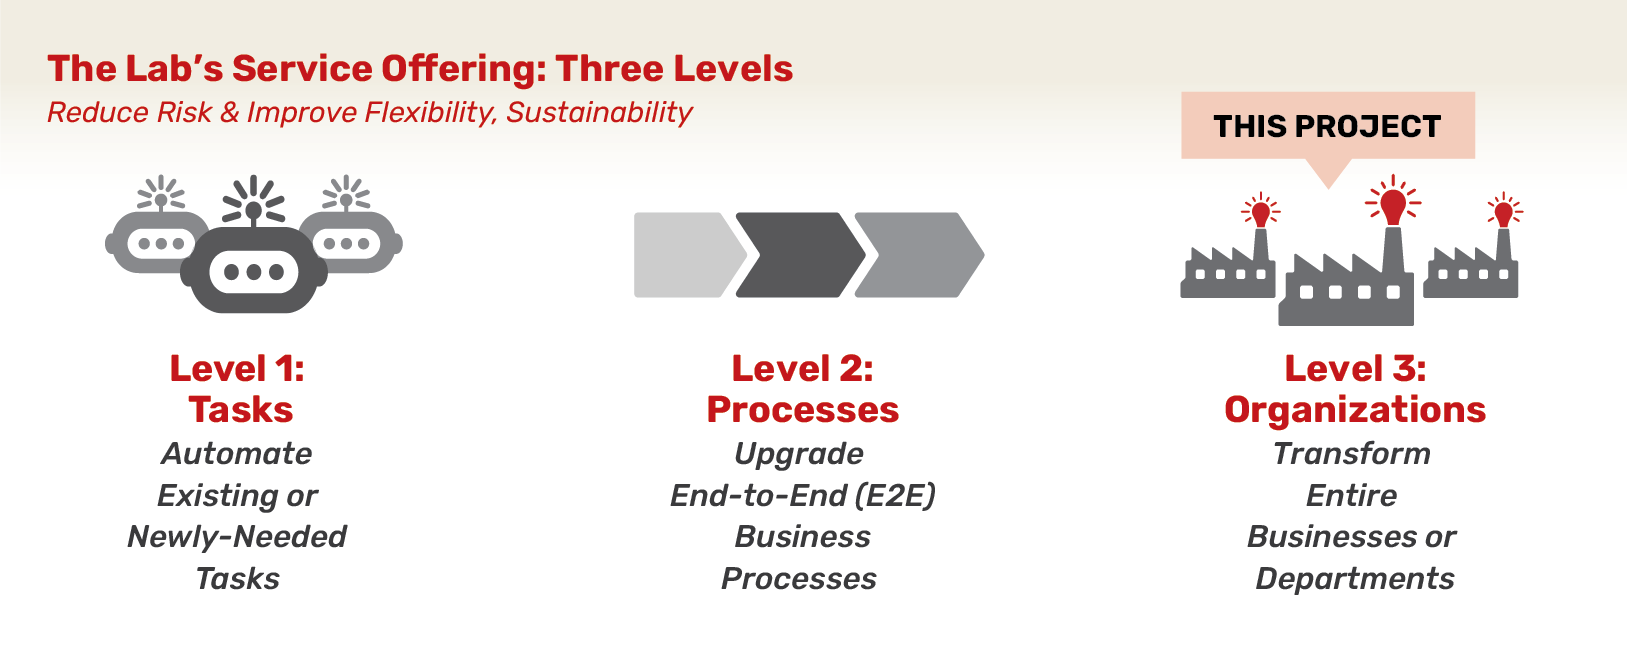
Improvement goals were established by area and/or by E2E business process, and the organizations involved could perform the work with any mix of resources they chose: internal resources, The Lab’s resources, or others. The Lab maintains a three-tiered service-offering structure (plus ongoing post-implementation support) to make this as flexible and sustainable as possible for clients:
The Lab’s improvement templates accelerated the effort. Order-entry errors were cut by half. The templates transformed the one-off activities of knowledge workers into standard work methods. The benefits of this process standardization were dramatic: On-time deliveries doubled. Cycle time fell 30 percent. Productivity rose 20 percent.
Improvement Examples, Service and Distribution Standardization
The Lab implemented 175 standardization improvements to improve efficiency and increase service levels. Examples:
The Lab Makes it Easy
Organization-friendly engagement design
At The Lab, we’ve spent three decades refining every aspect of our transformation engagement model. We’ve made it easy for clients—from the C-Suite to the front line—to understand and manage the initiative:
• Minimal use of client time: One to two hours each week, maximum.
• Measurable benefits: Typical 12-month ROI is 3x to 5x.
• Pre-built templates and tools: Process maps, data models, bots, and more.
• U.S.-based, remote delivery: Nothing is ever outsourced or offshored.
Designed to reduce risk, increase success
Since 1993, The Lab has led the industry in eliminating risk for our clients. Whether your engagement involves a handful of bots or wall-to-wall transformation, we make it easy to do business with us:
• Fixed pricing and clearly defined scope
• Pre-project feasibility/value assessments at nominal cost
• Early-out checkpoints and options
• Money-back guarantees
Book your free demo
The best way to learn about The Lab’s patented Knowledge Work Standardization® approach is to book your free, no-obligation 30-minute screen-sharing demo. And you’ll get all your questions answered by our friendly experts. Simply call (201) 526-1200 or email info@thelabconsulting.com to book your demo today!